Salary Survey of Business, Industry, and Government Statisticians
James Dias, Patricia Hall, and Varghese George, Biostatistics Consulting and Survey Center, Department of Biostatistics and Epidemiology, Georgia Regents University
This year, the Biostatistics Consulting and Survey Center in the department of biostatistics at the Georgia Regents University was contracted by the American Statistical Association to design and implement a survey of the association’s nonacademic members in the United States who are employed by business, industry, or government. Members were asked to report their annual base salary (in dollars) and instructed to include bonuses, incentives, or other forms of monetary reward. Salary was “annualized” for part-time employed respondents. All salary statistics are reported as full-time equivalents in dollars per year. Salary information, in the form of percentiles, is for a 12-month period and has been rounded to the nearest $500.
The ASA provided a member database of business, industry, and government statisticians. The database consisted of 5,943 members, 5,689 of whom had valid addresses. All members were invited to participate in the survey. The online survey was made available from February 8 to March 15. Responses were received from 2,081 individuals with valid addresses (36.6%). Of the remainder with valid addresses, 3,608 either refused or did not respond (63.4%). Based on the responses received, it was determined that 308 individuals were not eligible to be included in the final analysis.
Those who were ineligible were either employed in academia, unemployed, not employed as a statistician, retired, or reported that they did not meet the questionnaire’s definition of a statistician. Seventy-two individuals who were eligible and responded did not report salary information and were re-coded as “nonresponders.” When adjusted for delivery failure, eligibility, and nonresponse, 1,701 (2,081 – 308 – 72) eligible responses were received from an adjusted eligible total of 5,381 (5,689 – 308), for an adjusted response rate of 31.6%.
In the salary tables that follow, the 10th and 90th percentiles for table rows (categories) with fewer than 20 observations were suppressed. Also, all percentiles for table rows (categories) with fewer than 10 observations were suppressed.

Table 1—Annual Salaries ($1000s) of Statisticians in Business, Industry, and Government
Table 1 reports salary percentiles categorized by employer type, geographic region, managerial responsibility, gender, highest degree, years of experience, and application area or job type. Salary percentiles—cross-classified by years of experience, highest degree, and whether the respondent had managerial responsibility—are given in Table 2. Note that there were too few respondents with bachelor’s as their highest degree to be included in Table 2. Table 3, however, reports salary percentiles categorized by years of experience for those with a bachelor’s as their highest degree. Table 4 reports salary percentiles cross-classified by employer type and highest degree. Salary percentiles cross-classified by employer type, application area or job type, and highest degree are given in Table 5 for those with a master’s or doctorate degree.
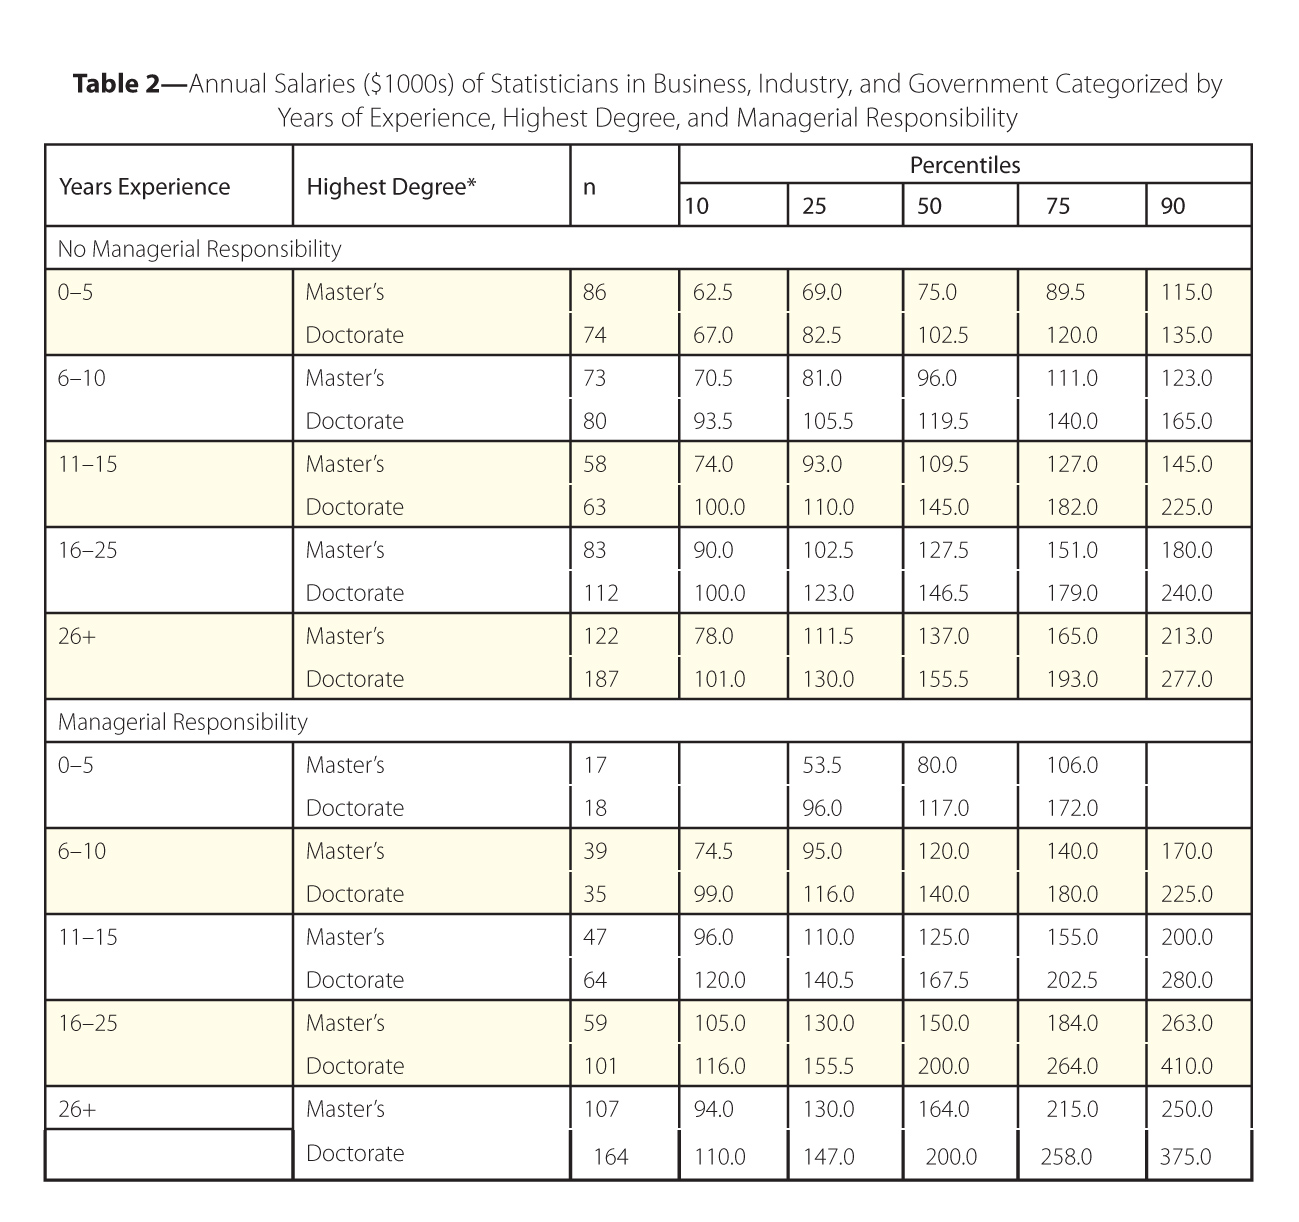
Table 2—Annual Salaries ($1000s) of Statisticians in Business, Industry, and Government Categorized by Years of Experience, Highest Degree, and Managerial Responsibility
*There were too few respondents with a bachelor’s degree to include in this table.
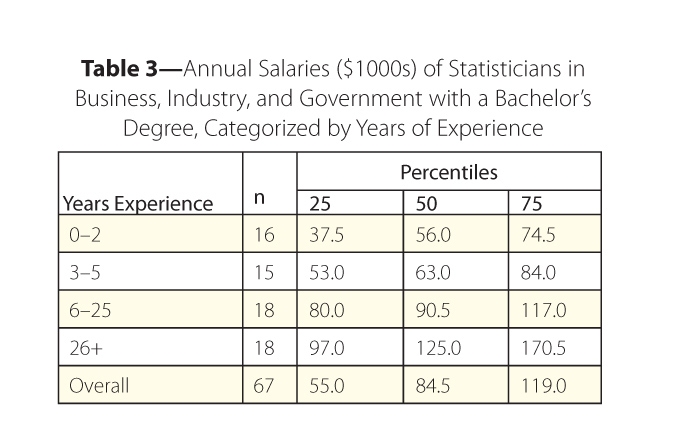
Table 3—Annual Salaries ($1000s) of Statisticians in Business, Industry, and Government with a Bachelor’s Degree, Categorized by Years of Experience
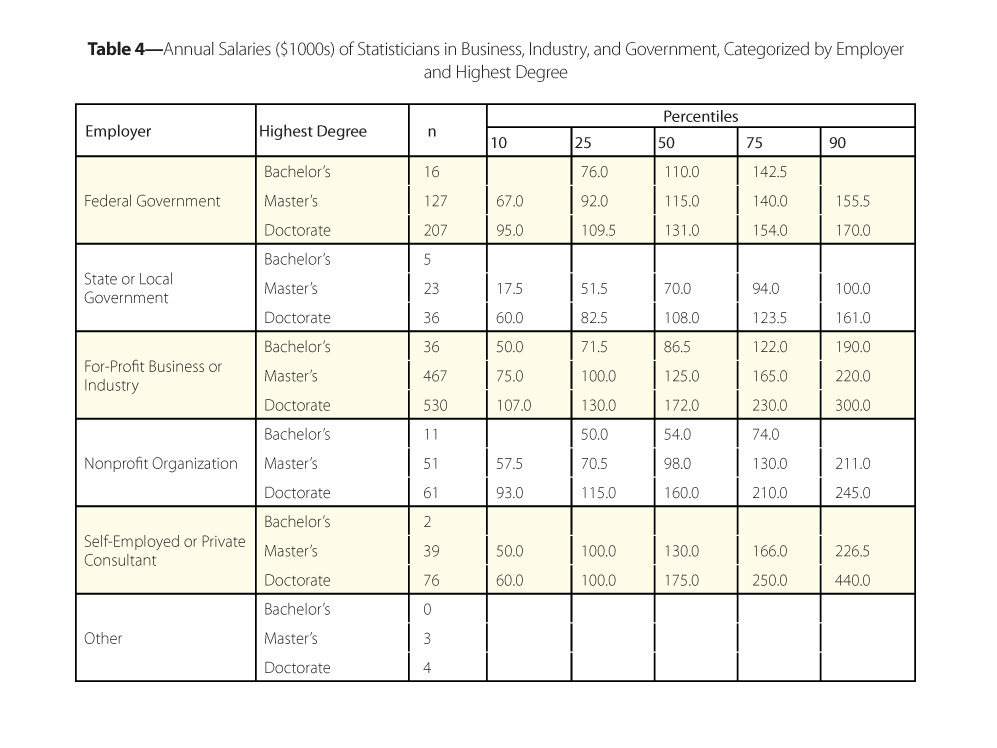
Table 4—Annual Salaries ($1000s) of Statisticians in Business, Industry, and Government, Categorized by Employer and Highest Degree
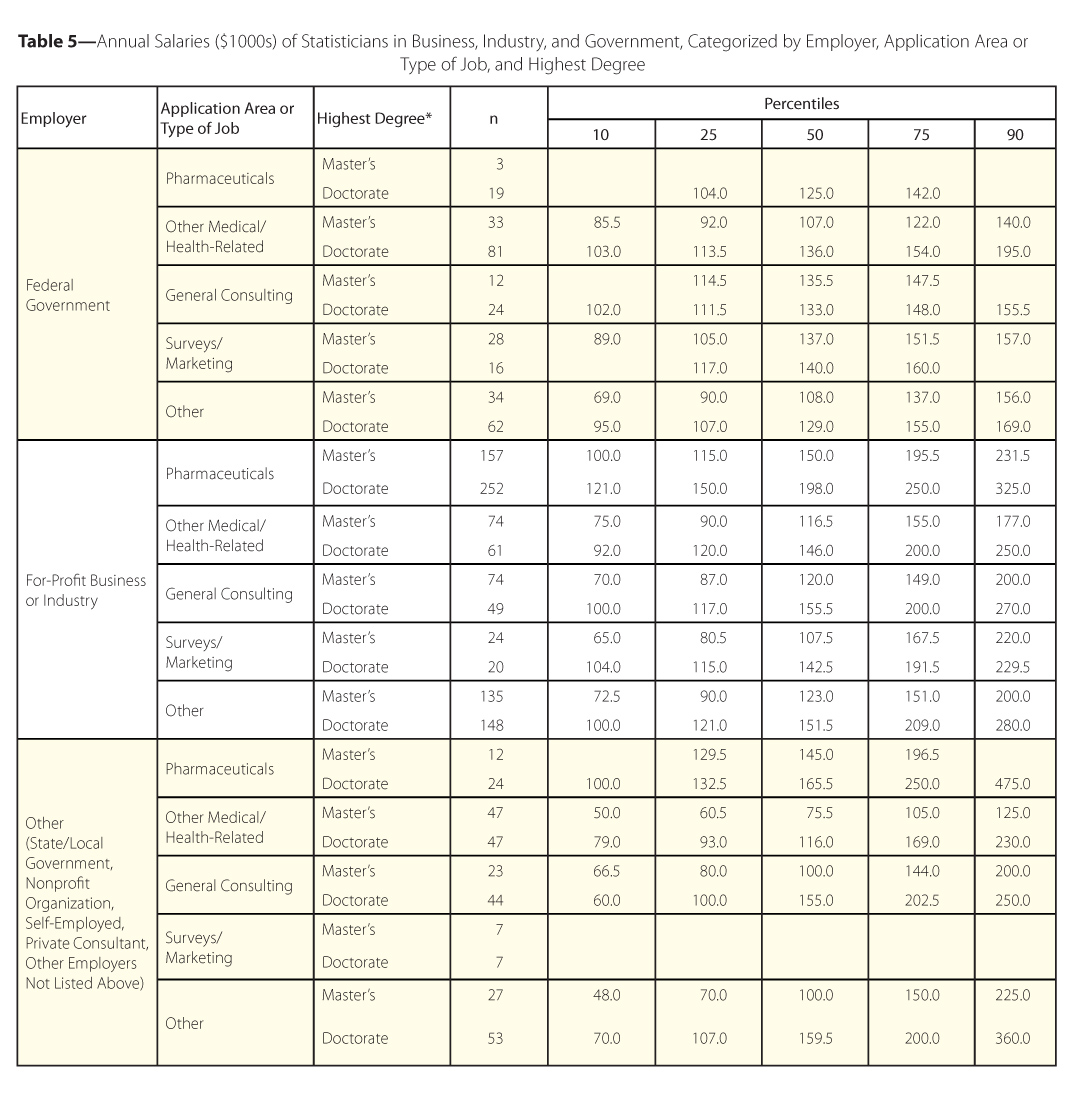
Table 5—Annual Salaries ($1000s) of Statisticians in Business, Industry, and Government, Categorized by Employer, Application Area or Type of Job, and Highest Degree
*There were too few respondents with a bachelor’s degree to include in this table.
A final report of the survey is available. In addition to the salary tables presented here, the final report details the survey design, its administration and implementation, survey response rate, respondent characteristics, and various descriptive statistics for selected survey items. The survey questionnaire and email invitation/reminder message also are appended to the final report.
The survey was conducted under the directives of Stephen Porzio, ASA associate executive director and director of operations, and the Statistical Partnerships among Academe, Industry, and Government Committee.


 (No Ratings Yet)


