Cultural Values, Statistical Displays
This column is written for statisticians with master’s degrees and highlights areas of employment that will benefit statisticians at the master’s level. Comments and suggestions should be sent to Megan Murphy, Amstat News managing editor, at megan@amstat.org.
Contributing Editor
Ian Crandell holds an MS in statistics from California State University, East Bay. He is a third-year PhD student in the Virginia Tech Department of Statistics. In his time as a collaborator at the Laboratory for Interdisciplinary Statistical Analysis (LISA), he has worked on 56 projects with university researchers. He worked under the auspices of LISA 2020 at Obafemi Awolowo University in Nigeria during the first half of 2015 to grow and sustain their nascent statistical collaboration lab.Ian Crandell

Emmanuel and I waited in my office for our client. She was a graduate student in health sciences, one of the first people I’d help during my six-month visit to Nigeria. When she arrived, she and Emmanuel exchanged pleasantries in their native language of Yoruba, leading in short order to the reason for her visit: how to report the results from her survey about maternity work.
After a thorough discussion, the client gave us her data and left us to produce the statistical displays. I worked with Emmanuel (one of the statistics undergraduates I am mentoring) for a few days, training him to think about what the data say about the research questions and how to bring those statements to light succinctly. We made crisp plots, answering the client’s questions with precision and adding nothing to clutter or distract from the thesis of her work. We submitted the job with pride.
Our client returned the next day, dismayed. She asked why we didn’t make more plots, where the tables were, and why we didn’t address every question on the survey. She asked for so much distraction and clutter that I was at loss for words. Why did she need all that nonsense? What I didn’t understand was that my aesthetic values were not hers, and that the qualities of a good statistical presentation depend on culture.
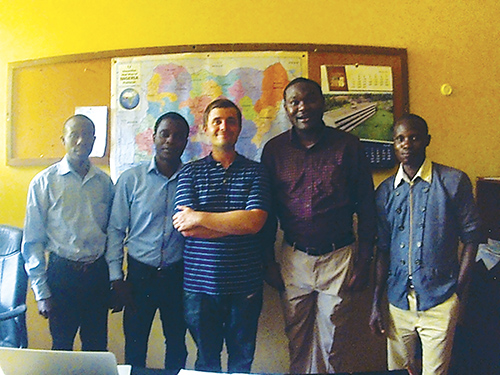
From left: Emmanuel, Femi, Ian, Olawale, and Edward make up the core members of the Laboratory for Interdisciplinary Statistical Analysis and Collaboration (LISAC).
In the United States, the predominant style for statistical displays is that put forth by Edward Tufte in books such as The Visual Display of Quantitative Information. Tufte’s style is minimalist and clean. He extols us to avoid unnecessary figures and cluttered graphs, to present data in a way that displays all the information but also illustrates macro scale trends. American statisticians are encouraged to think of displays as providing a clear and concise argument for, or against as the case may be, the researchers’ claims. Displays in this style make the researcher appear precise and competent, as if they understand their material so well they can distill it to its essence. As an American, these values are mine as well.
In January, I came to Nigeria as part of the LISA 2020 program—led by Eric Vance, director of the Laboratory for Interdisciplinary Statistical Collaboration (LISA) at Virginia Tech—to create a network of 20 statistical collaboration laboratories in developing countries by 2020. I am in Nigeria at Obafemi Awolowo University for six months to help grow and sustain the newly formed Laboratory for Interdisciplinary Statistical Analysis and Collaboration (LISAC), alongside its coordinator, Olawale Awe, the first LISA fellow. The lab here is the first (of three so far) statistics labs in the LISA 2020 network. When I came, I didn’t think Nigerians would share the same moral and cultural values as me—why would they?—but surely the aesthetics of statistical displays weren’t so dependent on culture.
While I still hold that Tufte’s style is the optimal style to appear as Americans want to appear, I now realize Nigerians have different priorities. Our client didn’t want a distillation, she wanted a transcription. She wanted us to summarize all the information, to lay it all out, to have the complete picture and not the interpretation of one. To Nigerians, in my experience, minimalist displays look lazy and even duplicitous. If our client had been able to articulate these cultural differences, maybe I wouldn’t have gotten so frustrated with her. I felt she wanted an absurd amount of plots, redundant tables, and multiple bar plots showing the same data as percentages and frequencies. These requests were anathema to me, explicit violations of Tufte’s exhortation to avoid extraneous figures and chart junk.
A few weeks later, another client came to LISAC, with data from a designed experiment in civil engineering, a textbook 2^3 full factorial with replicates. I was ecstatic to work on a well-designed experiment and put some of the cultural knowledge I had acquired to good use. Femi, another promising collaborator I am helping to train while in Nigeria, and I put together another fine report, this one more verbose. The client was happy at first, but kept coming back for questions of an increasingly technical nature. We even derived for him the normal equations for the coefficient estimates, manipulating block lettered matrices like Legos before his eyes. This also has been typical of my experience here. Nigerian researchers, unlike Americans, want to see all the equations.
Recently, another of our finest collaborators, Edward, produced 77 plots for a client. I’m pleased to report that the client was satisfied with our work, saying it was very thorough.
The point of all this is that, as statistical collaborators, we need to be aware of what our clients want to say about their data and, ultimately, about themselves. The Nigerian researchers I’ve worked with want to look like they have all the facts, like they’ve looked at every angle and can show you all the figures, like they understand all the math and could derive everything right here right now if asked. Other cultures will have other values they wish to display. Therefore, statistical aesthetics are dependent upon culture. Effective communication requires that we be aware of this and learn what clients from other cultures value.
Eventually, Emmanuel helped me understand where our client was coming from in making the requests about her survey. I was reluctant, at first, to do as she asked because I thought her requests would harm her case more than help it. But I misunderstood the case she was trying to make. Once I understood this, I apologized and we fulfilled her requests. As I’ve reflected on this encounter, I’ve come to appreciate the Nigerian style. Providing vast amounts of output gives researchers the ability to check our work and question our methods. It’s nice that my American clients trust me to provide only what I think they need, but I also have a lot of respect for the Nigerians who want to come to their understanding on their own.
Learning that statistical aesthetics depends on culture is one of the most valuable lessons I’ll take from my Nigerian expedition. But the lesson applies to all statistical collaborations, not just cross-cultural ones. All statisticians need collaborative skills; our science doesn’t exist in a vacuum. Now I know that to collaborate effectively, we need to understand how to help our clients speak, as well as what they want to say.


 (4 votes, average: 4.75 out of 5)
Great article Ian! I look forward to hearing more about all the other things you’re learning while in Nigeria. Anyone else interested in the LISA 2020 project can learn more at http://www.LISA2020.org
Thanks for the insightful, interesting article. We read and discussed it as a group at the LISA Weekly Meeting. It is very important to consider other cultural view points and to stay in the conversation with your collaborators to learn from them. Something we teach in the U.S. as objective fact can be seen so differently in another culture.
Our discussion, resulted in some hypothetical questions:
1. How does the Nigerian statistical aesthetic apply when there are many more graphs (e.g. 77 million)?
2. How about when there is a more sophisticated statistical analysis?
– LISA Collaborators Weekly Meeting Group
Fascinating article! I think it’s an important skill for statistical consultants to be able to empathize with clients, and we certainly don’t teach that in our courses. Thanks for drawing attention to this under-appreciated issue.
For this particular example, I don’t have to go very far to find people who disagree with my aesthetic. My spouse is also a statistician, and we sometimes have this same disagreement!
Excellent article. Great insights. I’m planning to have my students read it. It’s also quite relevant for conducting surveys in the States because we are a multicultural nation with new entrants from every corner of the world.
Thanks for the comments everyone! Let me respond.
LISA collaborators:
1. When there are a lot more graphs, the typical solution is to get a lot more paper.
2. The most sophisticated analysis I can think of is a factor analysis with a varimax rotation. The work was really great. In the appendix, the client included a table of all the principal components, the whole n by p matrix. It was exactly as daunting as you think it is.
Eric, Joshua, and Alice: I’m glad you enjoyed the article. I hope you can learn from my experiences. I’m especially excited for this to be used in a classroom!
Welcome!
Amstat News is the monthly membership magazine of the American Statistical Association, bringing you news and notices of the ASA, its chapters, its sections, and its members. Other departments in the magazine include announcements and news of upcoming meetings, continuing education courses, and statistics awards.
ASA HOME
Departments
Archives
ADVERTISERS
PROFESSIONAL OPPORTUNITIES
FDA
US Census Bureau
Software
STATA
QUOTABLE
“ My ASA friendships and partnerships are some of my most treasured, especially because the ASA has enabled me to work across many institutional boundaries and
with colleagues from many types of organizations.”
— Mark Daniel Ward
Editorial Staff
Managing Editor
Megan Murphy
Graphic Designers / Production Coordinators
Olivia Brown
Meg Ruyle
Communications Strategist
Val Nirala
Advertising Manager
Christina Bonner
Contributing Staff Members
Kim Gilliam
Contact us
Amstat News
American Statistical Association
732 North Washington Street
Alexandria, VA 22314-1904
(703) 684-1221
www.amstat.org
Address Changes
Amstat News Advertising