Who Inspires You?
Why did you become a statistician? What skills do you need to succeed? We asked some of our members those questions and here is how they responded.
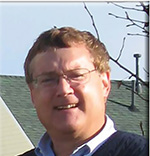
William E. Winkler
Principal Researcher U.S. Census Bureau
What or who inspired you to be a statistician?
I had a PhD in probability, which made it much easier to teach statistics at the university. I then went on to statistics as a profession.
What is the most exciting part of your job?
Working with good people on very challenging problems where we produce new methods and computational systems that were in our decennial censuses (3) and our economic censuses (4 going on 5). The systems and closely related methods/systems are used in other areas of applied statistics.
Name a few specific skills you need to do your job?
Willingness to work hard as part of a team doing data analyses and developing new computational algorithms in generalized systems for analysis and production. Willingness to produce new computational algorithms that are 10–100 times as fast as previously used algorithms so the systems meet minimum speed requirements for production.
What do you do in your job now that didn’t exist 10 years ago?
We developed theory and new computational algorithms for generalized systems for clean-up and preliminary analysis of sets of national files. With the new algorithms, a set of skilled individuals can analyze a set of national files in 3–6 months; with algorithms that are 100 times as slow, it is not clear how long the analysis would take.
Name one or two favorite blogs or books you have read and would recommend to others.
For certain areas of statistics, I recommend reading recent research in CS and OR, particularly as it relates to implementations of the Fellegi-Sunter model of record linkage and the Fellegi-Holt model of statistical data editing. Books on algorithms such as those by Sedgewick and Wayne and Knuth are very helpful.
What advice would you give to young statisticians just beginning their careers?
Learn pertinent theory and become good at computation as it applies to data analysis.
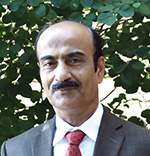
Vipin Arora
Senior Research Adviser, Eli Lilly and Company
What or who inspired you to be a statistician?
Reading newspapers (we didn’t have Internet in those days), the weather chart, the amount of data included on every page. My inspiration came from my father and high-school math teacher.
What is the most exciting part of your job?
Directly working on the strategy to develop effective and safe treatments for patients with various diseases. It is extremely fulfilling when I meet someone who has benefited from treatments in diabetes or cardiovascular or immunological disorders for which I played a key role in development, approval, and/or post-marketing efforts.
Name a few specific skills you need to do your job?
Analytical thinking, people management, collaborating with a cross-functional and diverse team, and readiness for new challenges both internal and external.
What do you do in your job now that didn’t exist 10 years ago?
Extensive use of visual analytical tools, virtual meetings, and coworking and collaboration spaces.
Name one or two favorite blogs or books you have read and would recommend to others.
ASA Connect (a discussion forum in the ASA community) and Harvard Business Review.
What advice would you give to young statisticians just beginning their careers?
See where your passion is, keep working at it, and soon you will achieve your aspirations. Always be positive, even in the most adverse situations. Make the best of every opportunity to learn, no matter where you are and with whom are you collaborating.
What do you enjoy doing in your spare time?
Exercise, cooking, gardening, and watching 007 movies.
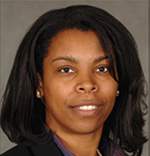
Kimberly Sellers
Associate Professor of Mathematics and Statistics, Georgetown University
What or who inspired you to be a statistics professor?
I was always drawn to a life in academia; my father is a retired professor and was dean of the Howard University College of Fine Arts while I was growing up. I’d say the more appropriate question for me is “Who inspired you to consider a career in statistics?” The answer would be Piotr Mikulski from the University of Maryland College Park. I initially entered graduate school to pursue a PhD in mathematics at Maryland and had predetermined two qualifying exam areas of study to be numerical analysis and ordinary differential equations; however, I still needed to identify one more exam area to round out my areas of study. Because I had taken and performed well in an undergraduate-level mathematical statistics course as an undergraduate, I decided to register for Mikulski’s mathematical statistics year-long course sequence in order for the statistics exam to serve as my third area. He made the material so interesting and enlightening that I loved the course! He was so personable and pleasant to be around; he even made the most abstract and/or challenging portions of the class enjoyable. Unknown to me and the rest of my course cohort at that time, we would wind up being the last group of students instructed by Mikulski; he passed away the following year. It’s been more than 15 years since his passing and I still think of him often and fondly and thank him for the significant impact he made on my life!
What is the most exciting part of your job?
The most exciting part of the job to me is traveling around the country and the world, presenting my work and meeting other colleagues. I love to travel, and this is a great way to see the world!
Name a few specific skills you need to do your job.
Obviously, you need a strong mathematical ability to do this work, but perhaps more importantly, you need to be able to communicate and promote your work effectively. In essence, you can think of yourself as a marketer. You want to get others as excited about your work as you are. Why should people care? What significance does the work have? Why is this important? Such issues must be addressed in all aspects of the job, whether it’s with grant-writing, authoring manuscripts, giving talks, or teaching. Likewise, a strong ability to explain your work (or any other relevant material) clearly and effectively also greatly contributes to your success in this career.
What do you do in your job now that didn’t exist 10 years ago?
I am using technology more and more as time progresses. I am developing R packages in association with my research projects and developing and/or using online course management tools for instructional continuity (e.g., Blackboard, Lecture Capture, etc.). For all these answers, while the tools may have existed 10 years ago, I wasn’t using them in the ways I do now.
Name one or two favorite blogs or books you have read and would recommend to others.
A blog that I would recommend to others, particularly those interested in a career in academia, is “Tomorrow’s Professor” (http://web.stanford.edu/dept/CTL/Tomprof/index.shtml). I have come across several posts that serve as valuable real-time reading and/or are helpful for future reference.
What advice would you give to young statisticians just beginning their careers?
Take advantage of the various opportunities that exist for young statisticians! Most environments offer some sort of one-on-one mentorship for young statisticians. Also, various statistics conferences (e.g., JSM) offer special meetings for young statisticians with opportunities for those just starting in their careers to ask questions and seek guidance from more established statisticians in their respective careers. One can always gain new tips of the trade that can prove helpful. More generally, get involved in an ASA committee and/or chapter. It’s a great way to meet and get to know other statisticians.
What do you enjoy doing in your spare time?
I enjoy lots of activities. I enjoy all types of fine arts, particularly music and dance performances. I also like sports (I’m a basketball fan) and traveling. I can easily name other activities too—I have rather broad and eclectic interests. I think much of that comes from just being open to trying new things and having different experiences, but that’s what life is all about, right?
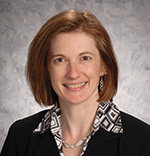
Jill A. Dever
Statistics Programs Director, Division for Statistical & Data Science, RTI International
What or who inspired you to be a statistician?
If I start at the very beginning, I have to blame it on those aggravating math flash cards. My parents worried about my slow progress in class, so every afternoon, instead of letting me watch “Rocky and Bullwinkle,” my father would sit with me at the kitchen table and quiz me while I grumbled. “Three times five? Nine times two?” Then there was the desire to keep up with my favorite, super-smart big brother, who helped me with calculus in high school.
Flash forward a few years. I’m a junior at the University of Louisville working toward a bachelor’s in mathematics. I walk into one of my favorite professor’s office, Steve Seif, and ask, “What in the world am I going to do with this degree?” “Well,” he said, “you like health and medicine. Ever thought about being a statistician?” So off to UNC Chapel Hill for a biostatistics master’s degree.
My UNC biostat adviser, Keith Muller, told me to seek out a career either in preclinical trials or that “survey stuff” I was learning at the (then named) survey research unit with Bill Kalsbeek. So, my fate was set as a survey statistician.
What is the most exciting part of your job?
The opportunity to learn new statistical techniques (e.g.,dual-frame RDD, ABS, and nonprobability studies) and then apply them to actual surveys. To date, I have worked on a variety of surveys that address issues of our times, including smoking cessation, physical therapy, erectile dysfunction, Gulf War Illness, and STEM education.
Name a few specific skills you need to do your job?
Communication skills are paramount; I would suggest this as a critical need for anyone. A solid foundation in survey research and programming skills is important. I would also add flexibility to the mix. I’m a planner, and sometimes your plans for the day are changed within the first 10 minutes. This was (and is) a difficult skill I learned on the job.
What do you do in your job now that didn’t exist 10 years ago?
That’s a tough question. Several methods for conducting surveys existed 10 years ago, but were not commonplace, including address-based sampling, the use of paradata, responsive designs, total survey error, and nonprobability web panels.
Name one or two favorite blogs or books you have read and would recommend to others.
Apologies for the self-promotion, but I would recommend Practical Tools for Designing and Weighting Survey Samples by Valliant, Dever, and Kreuter. This book is geared toward survey researchers at all levels with an eye toward reality. The historic textbooks assume perfection, such as complete participation from a nonresponse follow-up sample. Thankfully, we live in imperfection, or as I like to call it, job security. Also, this book highlights two fantastic researchers—Rick and Frauke—who are dear to me.
Also, I would recommend All Passion Spent by Vita Sackville-West. This is one of the books that taught me years ago to really live life and enjoy the ride.
What advice would you give to young statisticians just beginning their careers?
My young colleagues bring a fresh perspective to the science sometimes through seemingly innocent questions: “So why have we always done it this way?” Their energy is infectious. I thoroughly enjoy putting challenges before them and watching them flourish beyond their own expectations.
I have a few words of advice for young statisticians. First, cheat off of someone else’s paper. What I mean by that is you are no longer in school, so ask questions, borrow computer code, and mimic good writing styles. Second, pretend you are in school. Keep learning new skills and challenging the status quo. Finally, identify at least one mentor. It’s great to have a variety of support systems and perspectives.
What do you enjoy doing in your spare time?
My husband, Vince, and I enjoy working in the flower garden of our Capitol Hill home. I like to cook, especially when I have time to experiment with new recipes. I love to play with my three-year-old Labradoodle, Hero (named after the heroine in Much Ado About Nothing); traveling with my extended family; attending the theatre; and watching weird TV. Listening to music and dancing are great pick-me-ups when my energy is low. I also like to exercise, including yoga where I’ve learned to laugh at myself and stand on my head. My latest adventure is biking in DC. Karol Krotki is cheering me on.
Katherine J. (Jenny) Thompson
Methodology Director, Complex Survey Methods and Analysis Group, Economic Statistical Methods Division, U.S. Census Bureau
What or who inspired you to be a statistician?
I am an accidental statistician. My journey started when I entered college as an all-but-declared English major. On a whim, I decided to (re)take calculus I for the “easy A”; I’d taken calculus as a high-school junior. That first semester, my calculus professor was dynamic and interesting, and my English teacher was less so. Next semester, I signed up for calculus II with the same professor and took a little vacation from English class. The short-term vacation from the English department extended throughout college. By calculus III, I was hooked on applied mathematics. I declared my math major at the end of my sophomore year. For the record, although I could commit to a single major, I couldn’t do the same for a minor: I graduated with minors in dance and French, four credit hours short of a third minor in history.
My freshman calculus teacher became my adviser. I took every calculus class offered by the math department; I enrolled in every class that included the word “calculus” in the course description. Then, I left school for a semester to study in France during my junior year. When I returned, my adviser gently suggested I take a few classes that applied my math training in other ways (he was a little concerned about the obsession with calculus and the lack of physics classes).
So, during my senior year, I added operations research, probability and statistics, and data analysis to my schedule. I liked operations research and probability. I loved statistics and data analysis. More important, I discovered I had some ability. Every data set I studied told a story. Every theorem I learned had an application I could use. Many of my classmates were appalled at the idea of an expected value (“What—the probability of a point estimate being correct is zero?”), a measure of uncertainty, or a statistical relationship. In contrast, I embraced the confidence interval and accepted the reality of more than one plausible model for the same independent variable.
As graduation loomed, my statistics professor talked to me about pursuing graduate studies. He offered himself as a reference and contacted a few programs on my behalf. However, the idea of continuing my studies without any real practical experience frightened me. What if I was good at statistics classes, but not at statistics applications?
Instead, I decided to seek full-time employment at the U.S. Census Bureau and pursue concurrent graduate studies (part-time). If my undergraduate experience inspired me to consider being a statistician, my employment experience convinced me. One way or another, I’ve worked with survey sampling issues since I joined this agency, both on household surveys and economic programs. I’ve been blessed with career mentors and brilliant peers, all of whom share my passion for tackling theoretically interesting statistical problems applied to real-life data sets. And yes, I did finish that graduate degree in applied statistics—focusing primarily on survey sampling and estimation.
What is the most exciting part of your job?
That is a difficult question, as my job has evolved over time. Currently, I’m the methodology director for the Complex Survey Methods and Analysis Group in the economic statistical methods division. This position has administrative and research responsibilities. I supervise three separate branches of statisticians, whose work covers a wide range of topics, from sample survey estimation/variance estimation to seasonal adjustment to disclosure avoidance methods. I also conduct my own research projects and lead larger group research projects.
If you had asked this question 15 years ago, I would have sworn unequivocally that the most exciting part of my job was implementing methods or techniques that I had developed in live surveys. For example, the Survey of Construction’s housing starts indicator uses an estimator I helped redesign. The software I wrote to develop ratio edit limits using exploratory data analysis methods in 2000 is still used by Economic Census program managers for the 2012 collection. That’s pretty gratifying.
It’s a harder question to answer now. Years ago, I enjoyed conducting solo research. Now, I really look forward to collaboration. Over the past 25 years, I have been privileged: in-house, I have worked on many long-term (publishable) research projects and collaborated on several other projects with the academic community and other fellow federal employees. Collaboration sharpens my skills and broadens my horizons as a statistician, forcing me to keep up with new methods and techniques. Publishing our findings promotes the science (especially in survey methods) and publicizes the interesting problems and varied data I work with. Sometimes, I feel I have become an informal ambassador on the challenges of working with business survey data, which are sampled from highly positively skewed populations. Of course, there’s always a thrill to seeing your name in print in a refereed journal!
That said, I think the most exciting part of my job these days might be serving as team leader for directorate-wide research projects. Not only do I get to direct relevant research, but I get to consult with diverse sets of peers of varying experience and expertise. I have learned to use plain language to describe technical concepts to our subject matter experts, who are not statisticians. I have learned to delegate tasks while mentoring teammates. When I was younger, I sought the tangible benefits of my research. Now, I value the intangibles, where my coaching or directions provide leadership opportunities, learning and knowledge-sharing, or innovation from others.
Name a few specific skills you need to do your job.
Not to be glib, but the most important skills in my job are “reading, writing, and arithmetic,” plus some programming skills. Reading is absolutely crucial, especially in the area of survey research methods. With an increasingly tight budget climate and decreasing response rates, survey statisticians are responding with adaptive collection designs, alternative imputation methods, and increased use of Big Data.
To keep our programs relevant, we need to use these emerging cutting-edge methods to the greatest extent possible. Writing is just as important—not just for publishing, but for communicating with project stakeholders. In planning and execution, I need to get feedback from a statistically literate audience and industry (subject matter) experts who prefer an “equation-free” language. My arithmetic skills are always in play, whether for verifying a colleague’s results, deriving a linearization variance estimator, or validating proofs provided in a manuscript. Finally, applied statistics requires number-crunching. Programming skills are essential, especially for conducting simulation studies. I am a more-than-adequate SAS programmer these days, but I hope to learn R soon so I can talk the same programming language as the latest generation of statisticians.
What do you do in your job now that didn’t exist 10 years ago?
I’m a little weak on the actual history, but 10 years ago, I didn’t know anyone who owned a smartphone or tablet. Now I don’t know anyone who doesn’t! The Census Bureau has kept pace with these emerging technologies by developing mobile apps. If you haven’t seen it, I highly recommend you download the “America’s Economy” mobile app available for Apple and Android devices. This application provides real-time updates for 20 key economic indicators released from the U.S. Census Bureau, Bureau of Labor Statistics, and Bureau of Economic Analysis. The updates include a dashboard of the current indicator values with graphical information indicating the direction and significance of the change from the previous value, line plots of selected series, and access to the Census Bureau’s Economic Indicator Database.
I was involved in the development and testing of the graphics. Since the Economic Indictor Database was introduced to the public in 2009, it has undergone continuous enhancements, such as adding more programs’ series, offering different file formats for data set extracts, and providing interactive graphical displays for the series. I co-led a team that developed the requirements for these graphical displays, looking for simple-to-use data visualization tools that were implemented while maintaining strict compliance with the Census Bureau’s statistical standards. While the Economic Indicator Database team worked on adding these (user-requested) features to our Internet applications, the communications directorate was conducting parallel efforts, creating an eye-catching “indicators dashboard” for the Census Bureau’s home page and developing the accompanying mobile applications. Eventually, both teams joined forces. Ten years ago, I never would have imagined you could fit up-to-date information on 20 indicators on the screen of a tiny phone, let alone present it in an intelligible way! Now, I can’t imagine why you wouldn’t.
Name one or two favorite blogs or books you have read and would recommend to others.
It’s hard to narrow down the list to two books, let alone blogs! I cut my survey sampling teeth on William Cochran’s Sampling Techniques and still consult it frequently. However, I usually recommend Sharon Lohr’s Sampling Design and Analysis, which covers the same content in a more modern way (with real-life examples) and provides both the design-based and model-based perspectives. Once you’ve selected your probability sample and are ready to analyze the data, I highly recommend reading Applied Survey Data Analysis by Stephen Herringa, Brady West, and Patricia Berglund.
What advice would you give to young statisticians just beginning their careers?
Be prepared for some tedium! The more interesting projects are often earned by proving you can perform the less glamorous tasks cheerfully (or without complaining loudly) and carefully—such as running simulations, examining plots, and preparing summary tables. Look at what others around you are working on and see if you can eventually visualize yourself doing similar work. Ask questions and invite review before you share your work with a larger audience. Be grateful, not embarrassed, when someone catches an error in your work, and pat yourself on the back if the error was caught early. Keep reading. Your education shouldn’t end when you attain your degree. If you can, try to get hands-on experience while you are earning that degree by participating in a consulting program if offered by your school or through an internship. Finally, be open to change. Give everything time, but try to get a variety of experiences.
What do you enjoy doing in your spare time?
I’m a pretty active person outside the office. Running is my staple, alone or with a partner. In 2014, I finished two marathons, and I hope to complete another in 2015. I also like 10Ks, half marathons, and the rare metric marathon. I indulge in the occasional bicycle ride and practice yoga. I’m also really trying to learn to enjoy golf. This is much more difficult, as I have little or no hand-to-eye coordination, truly awful eyesight, and absolutely no patience. I’m a voracious reader of both nonfiction (mostly statistical journals) and fiction (especially mysteries and thrillers). Mostly, I enjoy spending time with my family. Both my teenagers have been involved in extracurricular activities, so I support them as a spectator, chauffeur, and volunteer (when needed). We also enjoy traveling together, especially if we can get two separate hotel rooms! As of September 2015, I’ll have a half-empty nest, with my son enrolled in college. This might give me a little more spare time, especially since I’ve promised my daughter I won’t devote all that extra time to her.

