DataFest Shows Spike in Growth, Provides Immersive Experience
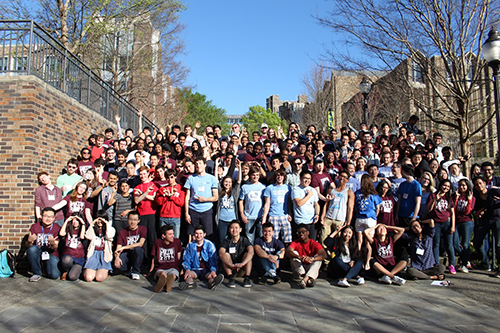
Participants in 2017 ASA DataFest at Duke University
Mine Çetinkaya-Rundel is the director of undergraduate studies and an associate professor of the practice in the department of statistical science at Duke University. She earned her PhD in statistics from the University of California, Los Angeles, and BS in actuarial science from New York University’s Stern School of Business.
For the last few years, spring has meant ASA DataFest and being immersed in a huge amount of data for thousands of college students. In a nutshell, DataFest is an annual 48-hour competition in which teams of undergraduate students work to reveal insights into a rich and complex data set. The data set is kept secret until the start of the competition, so students have no means to prepare for the contest.
Teams of up to five students compete over the weekend and are challenged to summarize their approach and findings in a four-minute presentation comprised of just three slides at the end. The students present their findings to a panel of judges for prizes in categories such as Best Insight, Best Visualization, and Best Use of External Data.
This extra-curricular immersive experience provides a medium for students to interact with large amounts of data without the constraints of the classroom.
ASA DataFest is a competition, but a friendly one. The mood is light, food and prizes are given out throughout the weekend, and students are encouraged to share ideas. The competitive nature of the event gives students a goal to work toward and keeps the teams motivated. The event also provides an opportunity for students to engage with analysts, statisticians, and data scientists from both the business and academic realms who serve as consultants.
Aside from being fun for the students and a good way to promote the discipline, DataFest serves multiple important curricular purposes. It brings students across all levels of the curriculum together, blending first- and second-year students with juniors and seniors. Participation from various majors also fosters interdisciplinarity. DataFest fills gaps in the curriculum that are otherwise difficult or impossible to discern based on traditional classroom experiences and assessments.
History of ASA DataFest
The first DataFest was held at the University of California, Los Angeles (UCLA), in 2011. In 2012, the event grew to also include Duke. In 2013, UCLA expanded their event by hosting students from Pomona College, the University of California, Riverside, Cal State Long Beach, and the University of Southern California, while Duke also hosted students from the University of North Carolina and North Carolina State. In 2015, the ASA became a sponsor of the event, which was officially renamed to ASA DataFest. Participation has continued to grow since, both in terms of number of institutions and number of students. In its first year, 30 students participated in the event; in 2017, that number grew to more than 2,000 from 31 institutions. (There is also an interactive visualization of growth of the ASA DataFest over the years.)
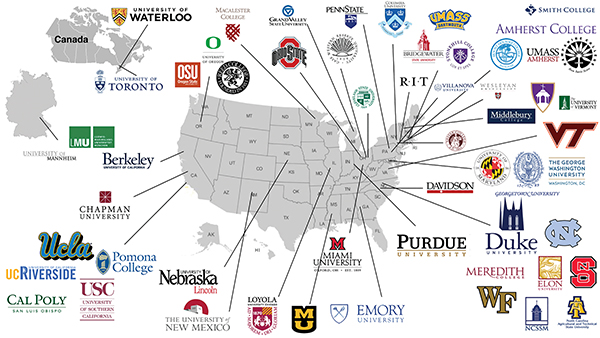
Institutions participating in the 2017 ASA DataFest
Each year, the data and challenge are different, but the common theme is making sense of Big Data—specifically data that are larger and more complex than what students are used to seeing in class.
2011: Every arrest in Los Angeles from 2005–2010. That is almost 10 million geo-tagged police reports provided by the Los Angeles Police Department (LAPD). The officer-in-charge of the LAPD Strategic Crime Analysis Section presented the data to students and challenged teams to suggest policy changes that could ativan online no prescription needed improve public safety.
2012: Microfinance, with data provided by Kiva.org, a non-profit organization that brokers micro-loans internationally. The challenge was broad. Kiva wished to know what outsiders would find interesting and useful, so invited the teams to discover any insight or association they thought meaningful for either lenders or lendees.
2013: Dating, or more precisely online dating, with data provided by eHarmony. The data consisted of approximately 1 million “user-candidate” pairs as suggested by the eHarmony matching algorithm. These data also included more than 200 variables with information about ideal characteristics in a partner, how important these characteristics are, “words friends would use to describe you,” etc., as well as a measure of success of the suggested match: whether the matched pairs contacted each other.
2014: How customers of GridPoint, a company providing energy management and sustainability solutions, can best save money and energy. The energy data provided by the company was augmented with supporting climate and location data.
2015: Detecting insights into the process of car shopping with website visit data provided by Edmunds.com.
2016: Investigating how site visits can be converted to ticket sales and how TicketMaster can identify “true fans” of an artist or band. Data were provided in three tables that could be matched by common fields, which presented a challenging but rewarding data wrangling problem for students.
ASA DataFest 2017
This year, the motto was “let the data take you places” and the data was provided by Expedia.com. Many students mentioned that they have been on Expedia.com as they look for tickets between home and school, so they were thrilled to get their hands on data they may have generated. The data consisted of two files: a primary data file of more than 10 million records and 27 variables and a destination file with more than 32,000 records and 19 variables. These records were from a sample of registered Expedia.com users from the United States, Canada, and Germany who had either clicked on or booked a hotel in 2015. One potential goal was to model users’ browsing and clicking behavior to determine whether they will book a hotel; however, many students explored geospatial and temporal patterns in travel preferences.
The event at Duke University started with a small group of just more than 20 students in 2012. This year, more than 340 students from seven universities (Duke, The University of North Carolina, North Carolina State, Meredith, Elon, North Carolina A&T, and Wake Forest) and one high school (North Carolina School of Science and Math) took part. This is a huge spike in growth, almost all thanks to past participants promoting the event to their friends and the data providers who help come up with exciting and relatable challenges each year.
Looking Forward
ASA DataFest is a data-centric educational tool that allows students to learn by doing. The breadth of the challenge shifts the focus from the search for the “right” answer to becoming creative with data. The complexity of the data set provides an opportunity for students to sharpen their ability to manage, clean, and explore data in addition to scaling models and other statistical approaches they have learned in their classes. The limited time frame of 48 hours coupled with the difficulty of the challenge allows students to appreciate the value of teamwork, which is something students often push back on in classroom settings.
Visit the ASA website if you would like to join in or help organize a local ASA DataFest, or need useful resources.


 (No Ratings Yet)


