Interview with Dennis Pearl
Allan Rossman, Cal Poly
This interview with Dennis Pearl, conducted by Allan Rossman of Cal Poly, originally appeared in the open-access Journal of Statistics Education, volume 25, issue 1. Read it in its entirety.
Dennis Pearl is professor of statistics at The Pennsylvania State University and director of the Consortium for the Advancement of Undergraduate Statistics Education (CAUSE). He is a fellow of the American Statistical Association. This interview took place via email November 18–29, 2016.
AR: Thanks very much, Dennis, for agreeing to this interview for the Journal of Statistics Education (JSE). Let’s start with the 18-year-old version of you. Where were you then, and what were your thoughts about education and career goals at that point?
DP: That would be 1969. I was a sophomore at Berkeley, protesting the Vietnam War and discovering I was no longer the smartest guy in the class like I was used to being in high school. I had a terrific AP calculus teacher in high school and figured I’d be a math major, go on to graduate school, and become a math professor. Unfortunately, I had a pretty boring instructor in my linear algebra class at Berkeley, and the same guy was going to teach the next course in the series, so I decided to shop for something else. My brother was a senior there and convinced me to take an introductory statistics class with him taught by Erich Lehmann. By the second week, I was hooked! My math classes were about understanding elegance, while statistics was about understanding evidence, and it just seemed the world needed more people who could do the latter.
At that point, I didn’t think much about education except noting which qualities I liked in an instructor and which I didn’t. I liked organized professors like Lehmann, witty professors like Elizabeth Scott, professors who kept their class involved in discussions like David Freeman, professors who had the class construct their own knowledge like Jerzy Neyman, and friendly professors like Kjell Doksum. Then, there was David Blackwell, who was in a class by himself, as the quintessential explainer of complex things and who also had all of the traits mentioned above. The Berkeley Statistics Department had a lot of great teachers, and all of them gave me a feel for the relevance of the subject. I had the opposite feelings about the math instructors I encountered and so I became a statistics major.
AR: My, that’s quite a list of professors you had as an undergraduate. What did you do after you earned your bachelor’s degree, and how did you make that decision?
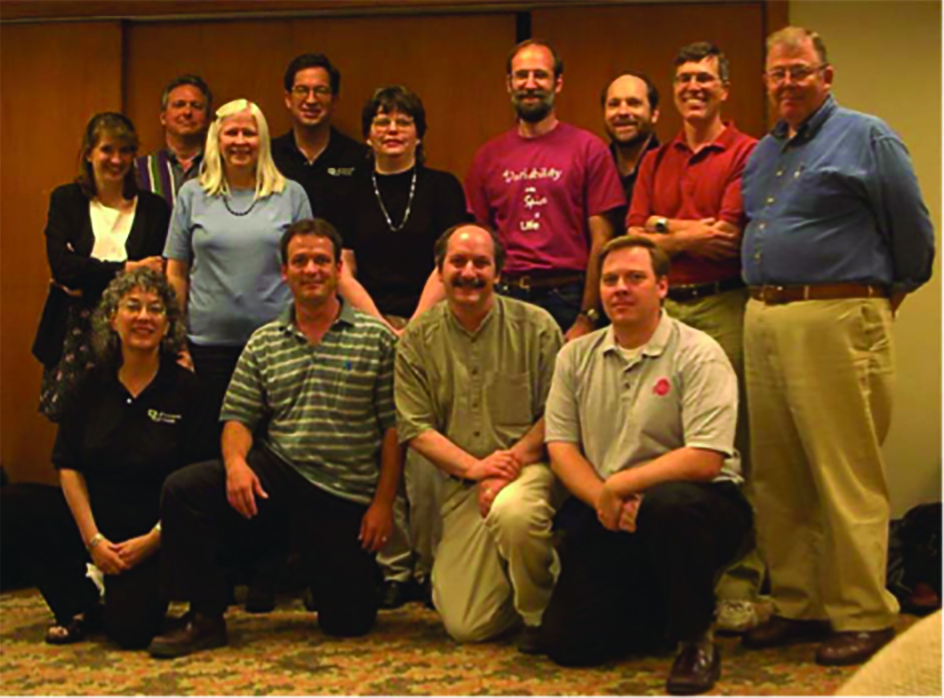
Back Row: George Cobb, Allan Rossman, Roger Hoerl; Middle Row: Beth Chance, Mary Parker, Deb Rumsey, Jeff Witmer, Bill Notz, Gale Rex Bryce; First Row: Joan Garfield, Paul Stephenson, Dennis Pearl, Rog Woodard
DP: Oops—I only had Neyman as a grad student—but his teaching style was unique. He just stayed seated and asked random students to go to the board and work things out. If you were lost, he called on someone else—but after a few sessions, every student worked like crazy to be prepared!
At the end of spring quarter in 1971, I had the units to graduate and I had no doubt I was going to grad school in statistics—but felt like I needed to slow down and possibly take some time off (I had only just turned 20 years old.). So, I postponed my graduation until after fall quarter and luckily was selected to take part in a National Science Foundation (NSF)-supported research program organized by an engineering professor, which turned out to be a life-changing experience.
It involved eight senior undergrads: two from math, two from statistics, two from engineering, and two from ecology. Our task was to model fire and its effects. We had access to four farmers in California who were doing controlled burns on their property. The math students worked out differential equations on how the fire might spread; my teammate and I in statistics designed the experiments to collect data, and then worked to analyze it; the engineering students devised the instrumentation to measure stuff; and the ecology students made predictions about the effects on the non-plant organisms in the burn area.
At the end of the summer, I was picked to go to the national AAAS meetings in Philadelphia to present our findings, where I heard talks by Carl Sagan and met Margaret Mead. That summer, I stopped thinking about statistics as a branch of mathematics and realized that what I wanted in life was a career as a statistical scientist, with the emphasis on science.
In my final quarter as an undergrad (fall 1971), I asked David Blackwell if he would supervise me in a reading course to attempt to model the spread of fire using ideas from game theory, so I was able to continue that experience with my teaching idol. From January until grad school started for me in September 1972, I spent a little time working to have enough money to travel around Europe, and I met my wife in Jerusalem (so my second life-changing experience in one year).
AR: That was quite a year! I hope you haven’t averaged two life-changing experiences per year since then, because that would probably be too much change. You stayed at Berkeley for graduate school, right? Did you consider going elsewhere?
DP: Yes—I stayed in Berkeley for another 10 years and never considered anyplace else for grad school. I was a T.A. for Freeman, Pisani, and Purves (2007) as they wrote their classic introductory text. I became involved in studies of molecular evolution when the field was just new. I worked on a congressionally mandated study of the effects of ozone depletion on human health (my dissertation was about a stochastic model of skin cancer), on studies of law school admission policies toward women and minorities, and on studies of the workings of the subconscious brain.
ResearchGate.net tells me I’m at about 7,500 citations now, and probably a good quarter of them came from my work as a grad student. So things were pretty interesting in my teaching, research, and collaborative work, while—during those years—our three children were born and my wife and I were reasonably active politically. I guess I slowed down to averaging perhaps a little under one life-changing event per year!
AR: Was teaching a strong interest of yours at that point or just something you had to do in addition to your research? Did you have opinions about the FPP text/course then; did you have input into its development?
DP: Well, I loved teaching and wanted to be better at it, but I wasn’t really thinking systematically about it. We would have weekly TA meetings and Freeman, Pisani, and Purves—but especially Freeman—would talk about the big ideas of the week and tell us how to remove the mathematics and just relay the core concepts of the discipline in English. I participated in the discussions, but I was just learning from them and not really contributing. After I taught the class once, I started speaking up more—about the details of the logistics of running the recitation sessions—to let the new TAs know what seemed to be working for me. It wasn’t really until I got to Ohio State and was coordinating TAs of my own that I started to take a more scholarly approach to teaching.
AR: Did you go to Ohio State directly from Berkeley? Did you also consider nonacademic opportunities?
DP: Yep—straight to Ohio State. OSU Statistics had been given five new positions and the chair of the department, Jagdish Rustagi, was visiting Berkeley and Stanford. He offered me a position based only on the recommendation of my adviser (Elizabeth Scott) and a 10-minute conversation with me. I never thought about nonacademic opportunities and the OSU position sounded great, so we moved to Columbus without so much as an onsite interview. Things worked differently then.
AR: I assume research was the top priority for new faculty, but what were your teaching assignments in the first few years, and how did you approach them?
DP: For my first couple of years at OSU, my teaching centered on graduate courses in discrete data, probability courses for engineers, and coordinating the large FPP-based intro course. For the first two, I worked hardest at developing examples that would engage the students and trying to make classroom discussions go beyond the same four or five top students. For the intro course, I worked hardest at coordinating the TAs, holding regular meetings with them, developing activities for them to do in recitation, and being sure they had what they needed to do a good job. By 1984, I started to work on changing from a lecture/recitation format to a lecture/lab format. I created an “honors” section of the course and wrote a lab activity manual for it. I wrote a grant to start the first computer lab for teaching in the arts and sciences at OSU and won that, so I was doing computer labs starting in 1985. Paul Velleman had just created DataDesk, and I wanted to use it a bit for exploratory analyses, but mostly for doing simulations to illustrate concepts.
Consortium for the Advancement of Undergraduate Statistics Education (CAUSE)
AR: I’d like to ask directly about a topic we’ve skirted thus far: your serving as director of the Consortium for the Advancement of Undergraduate Statistics Education (CAUSE). How did you come to take on this role, and what appealed to you about it? (I suspect readers are expecting to see “this was another Dick Scheaffer project” in your response.)
DP: Actually, it was Joan Garfield and Deb Rumsey who received funding from the ASA (but that was when Dick Scheaffer was ASA president, so the theme continues!) to hold a series of meetings about starting some kind of national undergraduate statistics education effort. We decided on a basic structure, with a director overseeing the organization and three sub-components (research, professional development, and resources), each supervised by separate associate directors. Deb was going to be the director, Joan would be the associate director for research, and Beth Chance and you [Allan Rossman] would share the role as associate director for professional development. Also, we hadn’t settled on an associate director for resources, though Jackie Dietz (who had just finished her successful stint as founding editor of the JSE) was considering taking on the job. As things turned out, Deb had a new baby and Jackie declined, so new team members were needed for those responsibilities. Joan called and asked if I would take on the role of director, since I had been active at the meetings. I agreed to try and work out a plan to do that and make it feasible to move the organization forward. I asked Rog Woodard, who was then at OSU and working closely with me on the Buffet project, to be the associate director for resources and asked Doug Wolfe, as chair of OSU Statistics, if the department could provide a course relief for Rog and I to take on those jobs. Everyone agreed, and we began to work.
AR: What were some of the early challenges, and also some of the early successes, for CAUSE?
DP: The challenge to me was to put together the financial and staff resources to get things done. I was confident I could do that—but my biggest fear was that I wouldn’t be able to get people interested in working on projects. Happily, there was lots of good will toward CAUSE in the statistics education community and I had an ace in the hole—Joan Garfield. Joan knew everyone and was respected by everyone. She gave me the names of folks to ask for help and, for the research-oriented things, she asked them herself. To my amazement, almost everyone said yes. Now, at that point, Lee Zia at NSF had created a wonderful vision for a National Science Digital Library (NSDL) that would be a repository of resources for teaching and learning in the STEM disciplines. So, I worked with Rog Woodard in putting together a proposal for CAUSE to operate the statistics education NSDL and CAUSEweb was born, with Rog as the editor, Ginger Rowell as the associate editor, and Justin Slauson as our web programmer. The NSF reviewers said the editorial board we assembled from Joan’s recommendations was a “Who’s Who of Statistics Education.” I agreed.
We also had a couple of other big successes in our first five years that helped propel things to the next level. Working with Tom Short, we received a major workshop grant (the CAUSEway program) enabling us to provide a series of about 30 multi-day workshops that were free to the participants. Then, working with Deb Rumsey, we launched the NSF-funded CAUSEmos program that supported three USCOTS conferences, provided funds for eight faculty-learning communities, and allowed us to hire Jean Scott as our program coordinator to handle the logistics of it all. Jean really became the face of CAUSE over the next eight years.
AR: I suspect this will be the most softball question of the interview: For someone who has never been to the CAUSE website or participated in a CAUSE-sponsored activity, how would you recommend they get involved, and why should they want to get involved? But let me make this question a bit harder by asking you to address three different groups: those for whom statistics teaching is their primary professional activity, undergraduate instructors in other disciplines such as mathematics or social sciences who occasionally teach statistics, and education researchers interested in statistics education.
DP: If you are a nonstatistician teaching undergraduate classes that involve statistical concepts, go to CAUSE to find a unique collection of songs, cartoons, well-researched quotes, and other fun items for teaching elementary statistical concepts, or find ways to connect your teaching to real-world applications though Chance News hosted on CAUSEweb.
If you are an education researcher interested in getting involved in statistics education research, go to CAUSEweb to find a searchable annotated index to the literature; national reports providing guidelines for programs, research topics, and methods; and links to appropriate assessment items and inventories in statistics education research.
If your career is in teaching statistics, then come to CAUSEweb to hear recordings of nearly 200 webinars and 100 hours of archived virtual conference sessions on the teaching and learning of statistics; come to share your own teaching tips and browse links to collections of online and hands-on activities and technological resources for teaching; find out how your students can take part in national undergraduate research competitions (USPROC) or in monthly cartoon caption contests; come to add your name to the map of people in statistics education and find others in your area; come to find out about how to implement new ideas in pedagogy like teaching statistical inference using simulation.
If you are in any of these groups, then come to CAUSEweb to sign up for our eNEWS, which will keep you informed about professional development opportunities like webinars, workshops, and conferences about teaching statistics and activities of the latest statistics education projects funded by NSF. And this is just a sampling. CAUSEweb is meant to be both a portal for anyone interested in the teaching and learning of statistics at the undergraduate level and a link to a great community of like-minded people.
AR: You mentioned “fun” items such as cartoons in this response. You’ve done a good bit of work (although that seems like an odd word choice here) to incorporate “fun” into teaching statistics. Can you summarize what you’ve done and learned on this topic?
DP: Yes—I’ve “worked” with Larry Lesser from The University of Texas at El Paso since the start of CAUSEweb in 2003 on the development of our collection of fun resources for teachers. Then, as part of a CAUSE faculty learning community on teaching with fun, we met John Weber from Perimeter College of Georgia State and started to do more systematic research in the area. We received an NSF grant in 2012 (project UPLIFT) to do randomized experiments of the effect of fun teaching on learning and student anxiety and also to remove some barriers that instructors had in using the resources in the CAUSEweb collection (e.g., providing high-quality recordings of songs). Results from our randomized trial were recently published in JSE (Lesser, Pearl, and Weber, 2016). It showed that students who were asked to listen and sing along with songs illustrating specific learning objectives got the correct answer on test items about those objectives an average of 7.7% more often than students who learned without the songs. Also, just last year, we received another NSF grant (project SMILES) that we are quite excited about. We are creating a large group of interactive that we are testing in new experiments. The interactive songs work kind of like MadLibs, where students are asked questions and then the words they use in their answers become part of the song via a synthetic voice. We hope the increased student engagement required will boost the learning gains provided by songs.
AR: Of all of your activities and accomplishments in statistics education, which one are you most proud of?
DP: I guess that would have to go to building up CAUSE, since that has had the most effect.


 (No Ratings Yet)


[…] Dennis Pearl […]