Design and Implementation of Professional Development MOOCs for Statistics Teachers
Hollylynne S. Lee is a professor of mathematics and statistics education in the department of science, technology, engineering, and mathematics education at North Carolina State University. Her current work focuses on using innovative approaches (like MOOCs) and powerful technology tools to engage teachers and learners in statistics education. She has numerous publications, holds multiple editorial positions, and has recently won several awards for her scholarship and teaching, including being named as an NC State University Scholar.
Dalene Stangl was on the statistics faculty at Duke University for 25 years and will begin a new venture with the statistics department at Carnegie Mellon University this fall. She has served as director of the Institute of Statistics and Decision Sciences; held editorial positions for JASA, Bayesian Analysis, The American Statistician, and CHANCE; co-edited Bayesian Biostatistics (1996) and Meta-Analysis in Medicine and Health Policy (2000); and served on review committees for the National Science Foundation, National Institutes of Health, and National Academy of Sciences. She has served as chair of the ASA’s Section on Bayesian Statistical Science and two terms as chair of the ASA’s Committee on Women in Statistics. She also orchestrated the first Celebrating Women in Statistics Conference.
Statistics continues to receive increasing attention in K–12 curricula through Common Core and recommendations from the American Statistical Association. Professional development opportunities for secondary teachers to develop their statistical content and pedagogy are popping up across the country, typically on a small local scale. The need is much bigger than what can be addressed with small local programs, however.
Online courses can expand the number of teachers reached and create communities beyond school or district lines. For a “massive” and “open” course, there are many design challenges to meet the needs of participants with varied backgrounds. Most massive open online course (MOOC) participants engage in isolation, reviewing material individually and perhaps engaging in discussion forums. Here, we share how two teams—a Duke team and a North Carolina State team—took on the challenge of designing and implementing two MOOCs that could assist teachers in teaching statistics.
Duke University
With funding from an ASA strategic initiative grant, the Bass Foundation, and Duke’s Center for Instructional Technology, Dalene Stangl, Kate Allman, Mine Çetinkaya-Rundel, and a group of master’s and undergraduate students designed and offered a MOOC in 2015 for secondary educators titled “Teaching Statistical Thinking.”
The course had three components: core, pedagogy, and software. Core focused on conceptual understanding of basic descriptive statistics. Pedagogy focused on lesson plan and activity development for teaching the statistical content of Common Core. Software focused on training teachers to use statistical software to analyze real data.
The course consisted of four units, each with three to six learning objectives, and lasted for five weeks. The core component contained 12 lecture videos by Stangl about univariate and bivariate descriptive statistics: graphics and number summaries. The videos made use of light-board technology adapted from Michael Peshkin at Northwestern University. This technology provides the advantages of a chalk board, but allows the lecturer to face the audience. The lecturer stands behind clear glass, writing with neon markers, as he or she is recorded. The video is flipped post production. Learn how it works (PDF) and see it in action.

Dalene Stangl explains standard deviations using a light board.
The pedagogy component consisted of an overview video in which Allman introduces the Understanding by Design (UBD) lesson plan structure. Education graduate students Courtney Mauck and Matt Miller present videos within each unit of the course demonstrating the use of UBD design and hands-on activity development using data on social media. Teacher resources for the classroom were also made available.
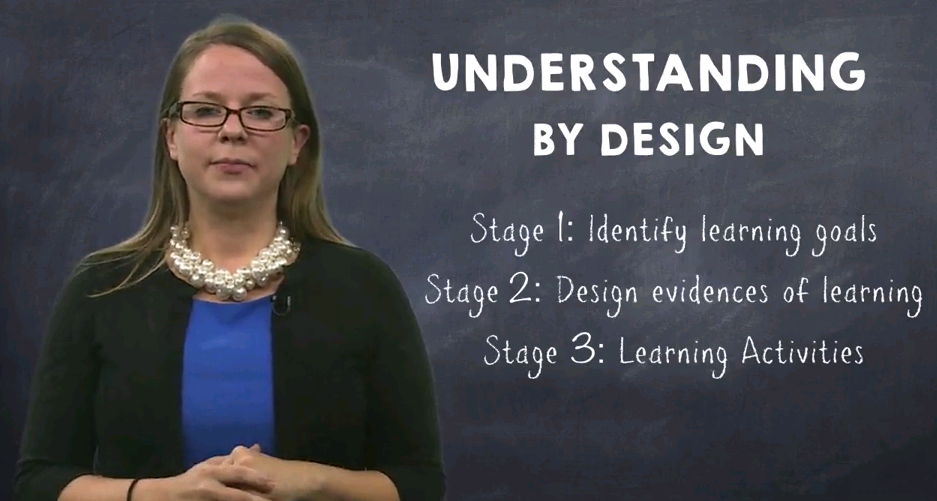
Kate Allman discusses the Understanding by Design pedagogy framework.
The software component included 25 videos by five Duke undergraduates demonstrating the analysis of fun data–targeting topics of interest to secondary school students. Data examples included Joey Votto’s baseball statistics, Forbes celebrity data, and the National Longitudinal Study of Adolescent Health. The software chosen was JMP, and a free one-year license was distributed to all participants.

Kathryn Odamah introduces teachers to JMP with video game usage data.
Beyond the three primary components of the course, discussion forums gave opportunities for interaction among participants, faculty, and teaching assistants. Applets created by Duke student Mao Hu provided another interactive resource for teachers to assess their understanding of the statistical concepts. Finally, extra resources (e.g., an online textbook and teacher resources from CAUSEweb and the ASA) were linked within the course resources.
NC State University
At NC State, with funding support from the William and Flora Hewlett Foundation and technical and professional support from staff at the Friday Institute for Educational Innovation, a team designed and offered a MOOC for educators called Teaching Statistics Through Data Investigations (TSDI). Lead designer and instructor Hollylynne Lee worked with Dung Tran, Theresa Gibson, and graduate students Tasha Elliott and Jennifer Lovett to design and implement the course. The MOOC-Ed effort at Friday Institute includes a collection of 10 MOOCs, all built using the design principles of effective professional development.
These include designing ways to foster self-directed learning, peer-supported learning, case-study and project-based approaches, learning from multiple voices, and supporting integration into blended (hybrid) learning contexts (e.g., teachers within a school or district completing the course together and meeting in person to discuss material or complete tasks).
The purpose of the TSDI course was to have participants think about statistics teaching and learning in ways that are likely different from their current practices in middle school through college-level introductory statistics. The course did not focus on a particular grade band or specific statistical content. A major goal was for teachers to be introduced to and use a framework to consider statistics as an investigative process with four phases (pose, collect, analyze, interpret) that incorporates statistical habits of mind and view learning statistics from a developmental perspective (aligned with Guidelines for Assessment and Instruction in Statistics Education [GAISE]).
The eight-week course consisted of six units, with five components in each. Units began with an introduction video and podcast of Lee explaining the structure of the unit and highlighting critical aspects of teaching and learning statistics participants can learn more about in the unit materials. The essentials included learning materials to read or watch that were created by the course development team or compiled from free online resources such as Journal of Statistics Education, the Statistics Teacher Network newsletters, and online videos from YouTube or other educational video repositories. The essentials often included video of real students and teachers engaged in statistics lessons. However, when data from Lee’s research or rich examples from statistics education literature were available, the team chose to create brief animated illustrations of real students’ work that communicated the essence of students’ reasoning and use of technology tools. Here are a couple of examples:
The design principle of learning from multiple voices guided the team’s decision for each unit to include a panel discussion video with Lee and three experts in statistics education: Susan Friel, Webster West, and Christine Franklin. In the last unit, for example, the experts discussed their hopes for the future of statistics education.
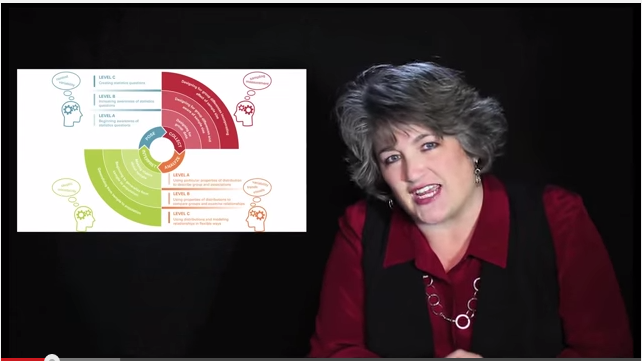
Hollylynne Lee introduces a framework in the TSDI MOOC-Ed.
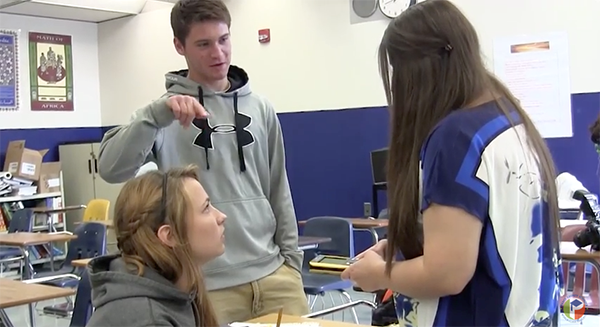
The Essentials often included video of real students and teachers engaged in statistics lessons. Here, students reason through a statistical investigation.

Animated illustration of students’ work on a technology-enabled task

Expert panel discussion with Susan Friel, Webster West, Hollylynne Lee, and Christine Franklin
Investigations required engaging in a learning experience (e.g., completing a survey, analyzing tasks, considering students’ work on a task, cleaning a large data set, analyzing and interpreting data). For units four and five, the investigation used the Census at School website and asked teachers to download data and engage in a cycle of statistical investigation. Participants could use any technology tool they had access to (e.g., TinkerPlots, Fathom, StatCrunch, JMP, NZ Grapher, and Tuvalabs). To help ease the technology burden, the team partnered with Tuva, embedding their data visualization tool directly into the course preloaded with a sample of 500 cases from Census at School data. Discussion forums gave participants opportunities to reflect and engage with one another and specifically posed discussion prompts to build a community of learners. Extensions included extra resources (e.g., data sets, lesson plans, brief articles, java applets, additional videos with experts) applicable to the unit.
Who Took These MOOCs?
The Duke University Coursera course attracted 9,281 participants to the site from 165 countries. Of these, 31% were from North America, 29% from Asia, 28% from Europe, 5% from South America, 4% from Africa, and 3% from Oceania. The drop off in the course mirrored what is seen in similar courses. Of the 9,281 who expressed interest, 5,708 visited the site once the course began, with 1,681 committed to complete, 2,336 committed to audit, and 1,691 remaining uncommitted. A subset of 3,153 watched the unit one videos, and of these, 37% watched unit four videos. The number of participants who completed the quizzes and final exam was much lower, with 500 or fewer people completing quizzes and 135 taking the final exam.
Few Coursera participants were high-school teachers, so post-course survey information was limited in terms of reaction by the intended audience. To get a better sense of reaction from high-school teachers, a two-day focus group was conducted. Sixteen North Carolina teachers were brought to Durham to engage with and evaluate course material. Overall, teachers were ecstatic and thankful that this was being done, yet regretted it had not been done sooner. They also lamented that there were not more videos showing actual classroom demonstrations. Course materials will be adapted based on these reactions.
All videos from the Duke course are now available on demand through YouTube. The videos can be watched individually or through playlists found on the profdstangl YouTube channel. Playlists are organized into core (16 videos), pedagogy (6 videos), and software (25 videos), or all three grouped by unit, with the five units containing 9, 14, 15, 10, and 4 videos respectively.
Since spring of 2015, the TSDI course at NC State has been offered six times, with 3,284 participants enrolled from 84 countries, but most from the United States. The majority of participants (64%) are classroom teachers in middle- or high-school and collegiate settings (universities and community colleges). There are also many enrolled (11%) who work as teacher educators in university settings (faculty) or other professional development roles.
Across each offering, data logs are used to assess engagement. For example, during the first offering in spring of 2015, 528 (66%) of the 797 enrolled participated in some way in the course. Of these, 180 were considered active participants who engaged with materials on at least five days. These active participants had either declining activity (54%) or sustained high activity through the final unit of the course (46% of active participants). Thus, of those who engaged in the course (n=528), about 16% of them completed it. These high activity rates through the final units are much higher than typical MOOC completion rates (2–10%), but are aligned with completion rates when participants intend to complete a course.
In spring of 2015, 308 (58.3% of the 528 visitors or active participants) participated in the discussion forums, with an average of 7.1 posts each. Examining click logs, we found there were also many more discussion views than postings. Some discussion views were by participants who were active posters; however, other views were by non-posters. Thus, many participants saw discussion forums as an opportunity for learning, even for only reading the posts of others. Participants who engage in such “lurking” are present, but not visible; thus, precisely why they read discussions and what they have learned from them is unknown.
How Platform Differences and Marketing Affected Enrollment and Audience
The Duke course was offered and advertised through the mega MOOC platform Coursera. This drastically increased its international visibility to potential participants. Using the Coursera platform also partially determined the potential structure of the course and ease of integrating features such as assessments. The TSDI course—and all MOOC-Eds offered through the Friday Institute—initially used Google Coursebuilder, and then transitioned to a customized version of Moodle as a platform for their courses. Such customization allows for flexibility in design decisions, such as embedding surveys and assessments from other sources.
While the TSDI MOOC-Ed has had much smaller enrollment in each run of the course, it seems to attract many classroom teachers. Advertising through the ASA’s Statistics Teacher Network newsletter, the CAUSE listserv, social media blasts (e.g., Facebook and Twitter), community college education networks, newsletters from IASE, and targeted emails to teacher education faculty and teacher contacts throughout the United States likely contributed to the large number of participants directly involved in either teaching statistics or preparing others to teach statistics.
Community-Building Efforts
The Duke team learned teachers especially valued the face-to-face time they had with peers. They enjoyed working with each other to navigate the teaching materials on the website, to ask each other questions about navigation of the site and the content, and to discuss the pedagogical utility of various videos and activities. This feedback has made the team wonder whether building opportunities for this type of interaction is essential for engaging teachers and getting them to use the materials in their classrooms.
In the TSDI course, the targeted advertising and early involvement of many in the discussion forums led to several groups of teachers committing to completing the course together. Some of these were groups formed within a district or school, and others emerged through participants pairing up by meeting in the discussion forums and agreeing to work on a course project together because of their similar interests.
We also noticed in the forums how participants often clustered in discussions with peers in later units when they had interacted with each other in earlier units. To facilitate community building in recent runs of the course, Lee was awarded an ASA member initiative grant to support the formation of small professional learning teams (PLT) of teachers who would meet face-to-face or through an online video conferencing tool to support one another in their learning through the TSDI MOOC.
In 2016–2017, nine teams were formed with 63 educators, each team led by a former TSDI MOOC participant or someone with a strong interest in improving statistics education in their local context. In examining the success of the use of a blended model for using the TSDI MOOC along with small group meetings, we have found much higher activity levels and completion rate (e.g., 71% of PLT members completed the course in fall of 2016), with many giving feedback that working together with colleagues to discuss materials in the MOOC and make plans for implementing changes in their local classrooms was highly beneficial and they would likely not otherwise successfully engage in online professional development.
Community building also extended outside the MOOC, particularly among teacher educators and those who conduct professional development. Many of these types of participants contacted Lee outside the MOOC to discuss their courses and professional development plans, particularly how they want to use particular TSDI course resources in their own work with teachers to prepare them to teach statistics. For example, a participant from Honduras translated several key resources to Spanish and used them in professional development with teachers.
Hurdles Encountered
In both courses, there were two major hurdles encountered in designing and implementing the MOOCs: teachers’ time and use of technology. In both courses, participants who were the primary intended audience (classroom teachers in middle school through college settings) expressed concern over lack of time to complete the course materials. Teachers wanted materials to support their own learning of concepts and ways to support their future planning, but were really more interested in materials they could use directly with students. Time to learn the material for themselves, especially during the school year, was viewed as a luxury they didn’t have, while having ready-made materials for their students was an indispensable need.
It was difficult for both design teams to find a balance between course length (with the right amount of material) and how much technology to incorporate. Finding the balance between breadth and depth within and across topics was challenging. People want short videos, so how does one encapsulate the gist of a statistical topic while still giving enough detail for engagement and conceptual understanding?
In terms of incorporating technology, teachers appreciate learning the details of a single tool, but are often concerned with the long-term sustainability of being able to use that tool in their classrooms, especially for free. Both teams tried to address the need for free and easily available tools by using and suggesting online applets for targeted lessons on particular concepts and by leaving their course open for participants.
Both teams strongly believed technology is indispensable in the teaching and learning of statistics. However, thinking about how to use technology in a course in which you do not know participants’ background or availability of technology was a major design challenge. Neither team integrated or promoted the use of a graphing calculator, despite recognition that it is often the only available tool in classrooms. Both teams were committed to exposing participants to more powerful technologies that could handle larger data sets and provide more advanced visualization and analysis techniques.
The Duke team chose to use a single package (JMP) early in the process (with free one-year licenses donated from the JMP division of SAS) and created support videos specific to that tool. The decision was fraught with uncertainty because of warnings that high schools were not yet letting go of TI-84s in favor of computers, yet knowing that—in a few years’ time—schools that do not transition students to tablets and computers will be left behind. The team also thought engaging teachers with easy-to-use statistical software was a major hook in getting them engaged with materials.
The NC State team provided several technology suggestions, some that were free (online tools such as Tuva, CODAP, Plot.ly, NZGrapher), temporarily free (temporary free licenses for TinkerPlots and Fathom, one-year-free licenses of StatCrunch donated by Webster West and Pearson, and JMP donated by SAS). That team pointed participants to support videos for each technology and created only a few specific support videos for certain software.
A final hurdle that must be addressed going forward is that more and more MOOC users are requesting mobile friendly content—video and resources that can be viewed on smartphones and other devices that have smaller screens. Users argue that much of their free time is spent in transit or in places where sitting at a desk or even sitting with a laptop is inconvenient. This creates a whole host of redesign issues. At NC State, the new Moodle platform and all the designs are explicitly made to be mobile friendly.
Summary
The Duke and NC State courses differed in approach. The Duke course was much more focused on providing experiences for teachers to learn statistical content, use statistical software, and develop instructional strategies that could be used in their classroom. The NC State course was focused on getting teachers to consider statistics differently and introduce them to ways of thinking about statistics that would support their students and guide their instructional practice. There was no presentation of statistical content beyond the four phases of a statistical investigation.
Participants in the NC State TSDI MOOC commented extensively about the usefulness of the frameworks, examples of students’ work, advice on teaching, and specific pedagogical strategies for teaching statistics—tasks and data to use in their classroom, especially with technology. However, several commented on the desire for additional resources to help them learn statistical content more deeply, like those provided in the Duke course.
Lee and Stangl agree this has been one of the most pedagogically and technologically challenging accomplishments of their careers. They also agree that the rewards of increasing teacher preparation to teach statistics in meaningful ways was well worth it!
While the course developed by the Duke team is no longer offered through Coursera, the content of the videos is available on demand at profdstangl. At NC State, the TSDI course continues to be offered, along with a follow-up course called Teaching Statistics Through Inferential Reasoning, which will launch this fall.
Further Reading
Franklin, C., et al. 2007. Guidelines for assessment and instruction in statistics education (GAISE) report: A pre-K–12 curriculum framework. Alexandria, VA.: The American Statistical Association.
Franklin, C., et al. 2015. The statistical education of teachers. Alexandria, VA.: The American Statistical Association.
Kim, P. 2015. Massive open online courses: The MOOC revolution. New York, NY: Routledge.
Reich, J. 2014. MOOC completion and retention in the context of student intent. EDUCAUSE review.


 (No Ratings Yet)


