Survey of 2016–2017 Graduates Yields Insights for Current, Prospective Students
Steve Pierson, ASA Director of Science Policy
Is there a typical bachelor’s graduate in statistics? Are graduates finding well-paying and satisfying jobs? Can students learn from the data and advice of the graduates responding to this survey?
No, yes, and absolutely!
Reflecting on John Tukey’s well-quoted quip that statisticians get to play in everyone’s backyard, bachelor’s graduates in statistics are going into a rich variety of jobs and graduate studies. With roughly twice as many graduates starting a career as continuing studies, new employees had 171 unique job titles—out of 262 job titles reported—in 230 companies.
They are also being paid well, with a median starting salary of $56,200 and job satisfaction (for salary, security, challenge, responsibility, and advancement) all being in the 75% to 85% range.
The graduates responding to the survey were also generous with their academic and job search advice for current and prospective students, generally urging more computer science and math courses (or even a second major), internships and other applied/real-world experiences, and more attention to writing and communication skills.
The impressions above—and the information presented below—are based on the ASA’s two surveys of new bachelor’s graduates, one done last year of the 2016 graduates and one done this spring of 2017 graduates.
With the number of students earning bachelor’s degrees in statistics in the US quadrupling from 2010 to 2017, the ASA established the survey to better understand the growth. The results are intended to be helpful to the following three main audiences:
- Current statistics students to inform both their remaining studies and planning for post-graduation
- Potential statistics students as they decide on a major or majors
- Faculty and administrators as they advise students, design curricula, and allocate resources
To be especially helpful to the third audience, department-specific reports are provided to departments with sufficient numbers of responding graduates.
The Results
Turning to the survey and results, 292 graduates participated in this year’s survey, which was distributed in spring 2018 and asked about employment or graduate student status as of March 5, 2018. Answering the entire questionnaire were 251 students. These numbers are up slightly from the 2016 survey—271 participants, 215 responding to all questions—though the number of universities represented is down from 52 to 47.
In the following, the results from the surveys of 2016 and 2017 graduates are combined. In general, results were similar from 2016 to 2017, but notable exceptions are highlighted below.
Because of the varying engagement of departments and the difficulty of reaching students who have left the US, we can’t claim the 466 graduates from both years who responded to the entire survey are representative of the entire population of the 6,188 reported by the National Center for Education Statistics (NCES) for 2016 and 2017. Of those providing gender identities for the ASA survey, 214 were female, 230 were male, four selected “other,” and three preferred not to say. The percentage who are female, 47%, is somewhat higher than the 43% in the NCES data.
For citizenship data, where NCES data show 30% of 2016 and 2017 bachelor’s degrees going to nonresidents, 17% (74) in the ASA survey reported being non-US citizens (36 from China, seven from South Korea, and four from Canada) and 83% (376) reported being US citizens.
The universities with the most 2016 and 2017 graduates participating in the survey were Brigham Young University (50 students), the University of Illinois at Urbana-Champaign (UIUC) (28), The University of Chicago (17), the University of Michigan (17), Columbia University (13), The Pennsylvania State University (13), and North Carolina State University (10). UIUC had the most graduates represented, 25, in the survey of 2016 graduates.
Information About Undergraduate Studies
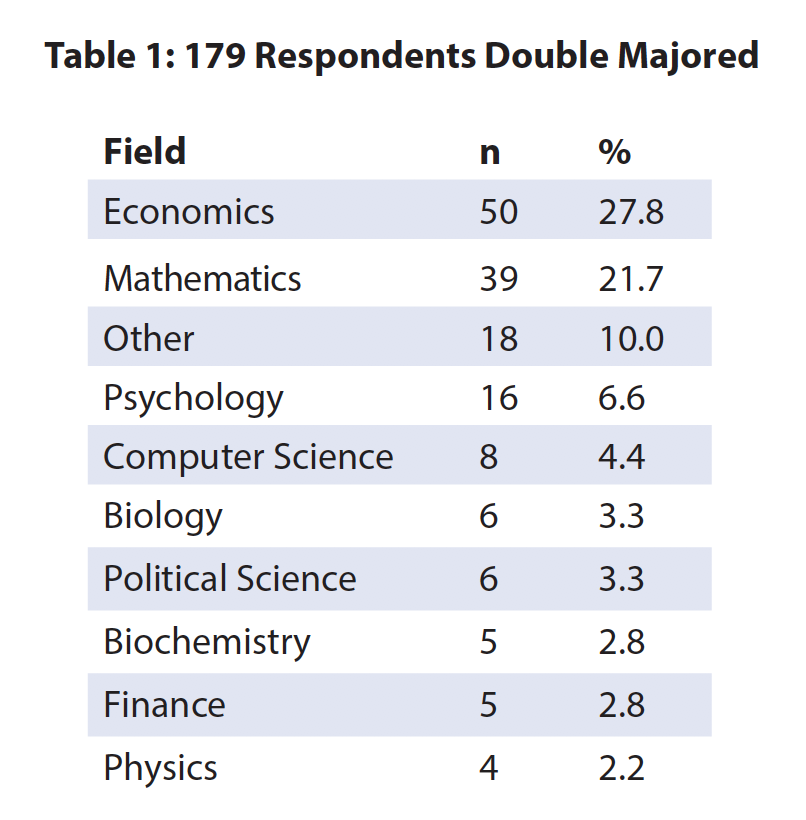
A sizable portion of the graduates participating had busy academic schedules with both their courses and non-classroom engagements with statistics. Roughly a third—179—said they graduated with a double major, with the most common companion major being economics and mathematics (Table 1). One hundred twenty-two students indicated they had minored in a field, the most common being mathematics (31), business administration (15), computer science (13), and economics (11).
To probe the outside-the-classroom learning experiences as undergraduates, the survey asked about internships, research, and capstone projects and how they regarded such experiences for their education and career. One hundred thirty-nine graduates said they did a thesis or capstone project; 211 said they did an off-campus internship or industrial co-op; 177 said they did on-campus research; 34 said they did an NSF Research Experience for Undergraduates; 48 reported other summer research on another campus; and 49 said a DataFest or hack-a-thon. If there was much movement from the 2016 graduates survey to the 2017 graduates survey, it was in relatively large increases for off-campus internship or industrial co-op and on-campus research.
For these experiences, graduates were asked, “How do you feel your above experience(s) affected your current situation?” The open-ended responses, available to view in the online supplemental material linked at the end of this article, seemed to be overwhelmingly positive. Taking an impressionistic (i.e., nonscientific) approach to the responses, the following were typical:
- “Greatly helped me prepare for and obtain my full-time job.”
- “They greatly improved my chances and interest in furthering my education.”
- “Gave me real-life applications of classroom learning.”
- “Good exposure to professionals working in the field.”
(The ASA would welcome volunteers willing to do a more scientific analysis of the open-ended responses.)
Despite the generally engaging learning schedules inside and outside the classroom, respondents were relatively vocal when asked what they would do differently. Common themes from the 328 responses—all available to view in the supplemental material online—were taking more computer science, programming, or coding courses and, to a lesser extent, mathematics courses; applying themselves more to their studies; and having more research or hands-on experience. Responses included the following:
- “Improve my coding abilities (e.g., learn SQL).”
- “I would have done more to try to secure an internship.”
- “Supplemented with a second major in mathematics.”
- “Take more programming/computer science courses.”
- “I would have taken more seriously my English/writing classes.”
- “Focus on education more than grades.”
The advice provided for current statistics students tracked with the responses above of what graduates would have done as students. Programming/coding skills were most frequently recommended, followed by gaining experience through internships and related activities. More mathematics, double majoring, and learning more statistical programming (e.g., R, SAS, SQL) were also recommended, as reflected in these select responses:
- “Learn as much coding as you can.”
- “Internships and research help so much in terms of job prospects and self-development!”
- “I strongly recommend double-majoring, as statistics is relevant in almost all subjects these days.”
- “Take more math courses. Have fun!”
“Don’t worry about whether you want to have a career in statistics – the skills and the way it helps you learn to think can be helpful no matter what field you end up in.”
Students were generally quite positive about how well their undergraduate program prepared them. Eighty-three percent agreed or strongly agreed (7% disagreeing or strongly disagreeing and the balance neither agreeing or disagreeing) their program prepared them to effectively analyze and interpret data critically using statistical models; 77% (11%) to effectively analyze and interpret data critically using computational methods; and 76% (11%) to effectively communicate, both orally and in written form, results of statistical analyses to a variety of audiences.
Regarding their job search, students generally took advantage of help from their statistics department and faculty or the on-campus career counseling center. Two hundred fifty respondents said their statistics department or the faculty provided career guidance; 205, no. Similarly, 247 said they used their on-campus career counseling center; 208, no. Of those who used a campus career counseling center, 153 found it useful though, when elaborating, were more temperate in their remarks. The 145 comments are available in the supplemental material, the following being a small selection:
- “The most useful part was being able to connect with alums and talk about what they do day to day.”
- “Mock interview, help me with my résumés and cover letters.”
- “When I was considering statistics, they helped me see all of the possible career options that were made available by obtaining the degree.”
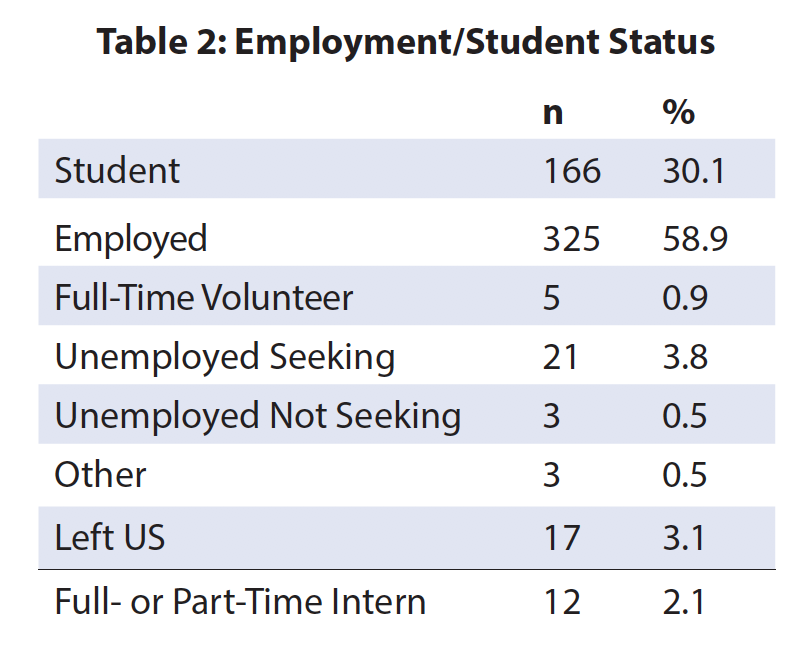
After their undergraduate studies, twice as many respondents found jobs as those who continued their studies. Of the 552 respondents, 325 (59%) listed themselves as employed, 166 (30%) as a student, and 21 (4%) unemployed (see Table 2). One hundred seventy listed themselves in full-time degree programs and another 79 (14.3%) of the employed said they were planning to begin a degree program in the future.
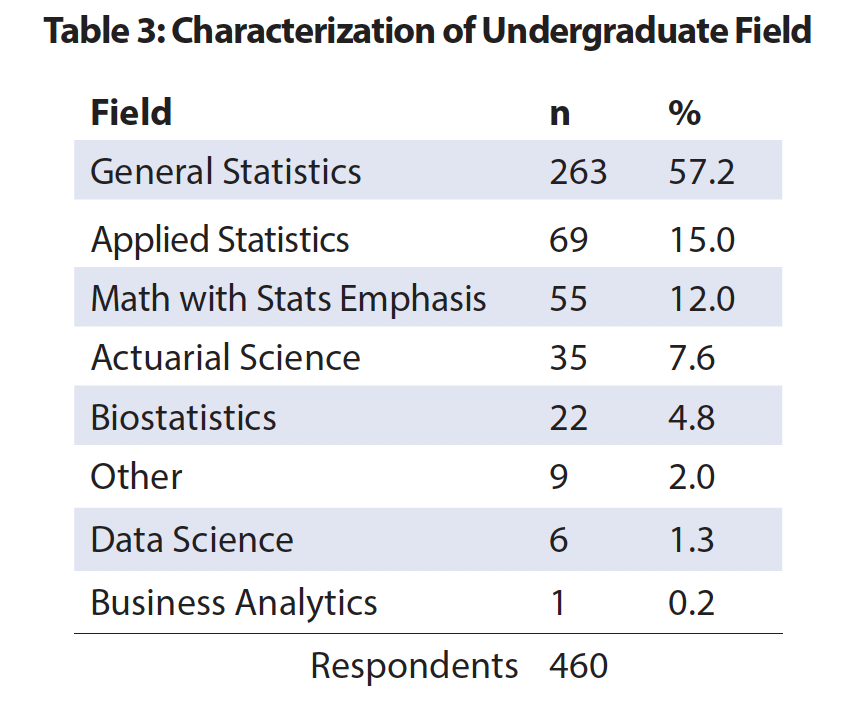
Of the 220 who characterized their undergraduate field (Table 3), 62% listed statistics or biostatistics. Three hundred fifty-eight of the respondents graduated from universities for which the highest degree offered was a PhD, 138 graduated from universities for which the highest degree offered was a master’s, and 56 graduated from universities for which the highest degree offered was a bachelor’s. Three hundred forty-six graduated from a public university; 206 private. Of the 459 who responded to the question, 236 said they had taken AP Statistics.
Employed
The respondents who obtained jobs seem to be well paid and generally satisfied with their jobs. They also work for a diverse and large group of employers with generally unique job titles. The median salary for those employed full time and providing salaries is $56.2K, the 25th and 75th percentiles being $48.0K and $69.5K. For an approximate comparison, see this graph from the American Institute of Physics showing middle-50% salary ranges for 15 fields for the class of 2015. Statistics tracks most closely with mathematics and finance.
For what employment sector these graduates are in, 195 (72%) of the respondents specified company or business; 13 (5%), government contractor; 11 (4%), four‐year college or university; 10 (4%), nonprofit organization; 9 (3%), other federal agency; 7 (3%), self‐employed and/or consultant; 6 (2%), state or local government; and 5 (2%), hospital or medical facility.
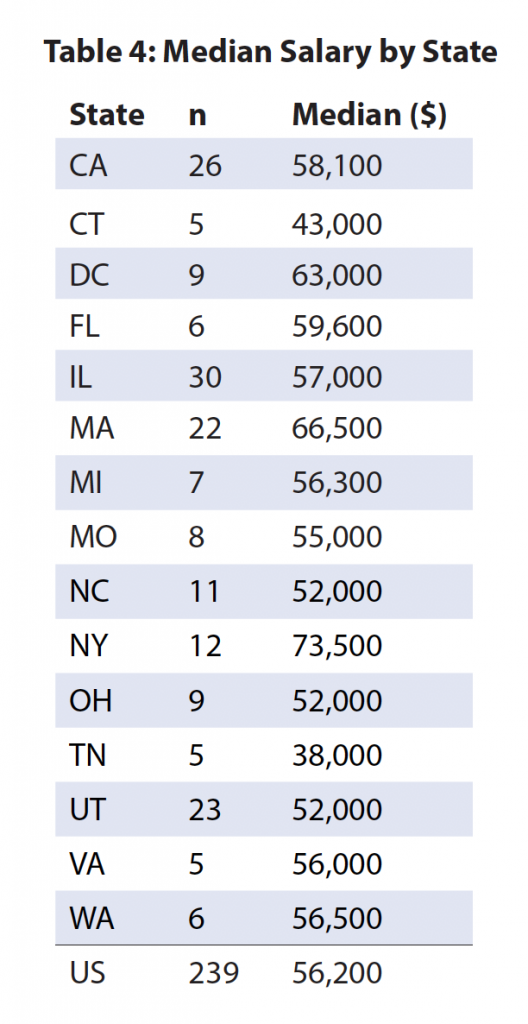
The median salary was the highest for those employed full time by “other federal agency,” $66.0K (eight reporting). Looking at the other median salaries for which there were seven or more full-time salaries reported, the next-highest median starting salary was in the company or business sector at $60.0K (186 reporting), followed by government contractor at $55.0K (12), nonprofit organization at $46.8K (7), and four‐year college or university at $43.0K (10).
Table 4 shows the median salaries for all sectors for the states with an n of five or greater.
Most employed graduates received one job offer, and 83% of those responding thought their statistics or statistics-related major was very or somewhat influential in securing their current position. Of the 272 who reported themselves as employed and responded to this question, 140 reported one job offer, 75 reported two, 35 reported three, 10 reported four, and 7 reported five or more job offers.
When describing job search experiences and what might help locate and secure a position, the responses are varied, with many citing internships, career fairs, or career centers; others noting department newsletters or help from professors; and still others referencing job search websites. Here are select responses (with all responses posted in the supplemental material):
- “I was offered the job after an internship.”
- “Sent out 10+ applications after extensive research.”
- “Send out a résumé to every company you would be interested in working for.”
- “I relied heavily on the newsletters that my statistics department sent out frequently (at Brigham Young University). During recruiting seasons, I could get several emails in a day about companies looking for interns or full-time hires.”
- “Glassdoor was the most helpful tool in finding a job. I also used LinkedIn and my university’s job bridge.”
- “It wasn’t difficult to find interviews in statistics-related positions, but the positions were competitive, and I was turned down from a few jobs before I found mine.”
Job satisfaction in several categories seems quite high. Eighty-four percent were very or somewhat satisfied (16% very or somewhat dissatisfied) with the position they held at the time of filling out the survey. Seventy-nine percent were very or somewhat satisfied with their salary and benefits, 90% with their job security, 78% with the opportunity for advancement, 74% with the intellectual challenge, and 85% with their level of responsibility. These satisfaction levels are generally in the same range as those of physics graduates.
As noted above, the diversity of job titles and number of companies employing statisticians is impressive. There were 171 unique job titles among 262 job titles reported. The most common were data analyst (18), analyst (17), actuarial analyst (16), and data scientist (11). Two hundred thirty-one unique employers (of a total 255) were listed.
The 255 graduates who categorized themselves as employed and provided the state were employed in 38 states and the District of Columbia.
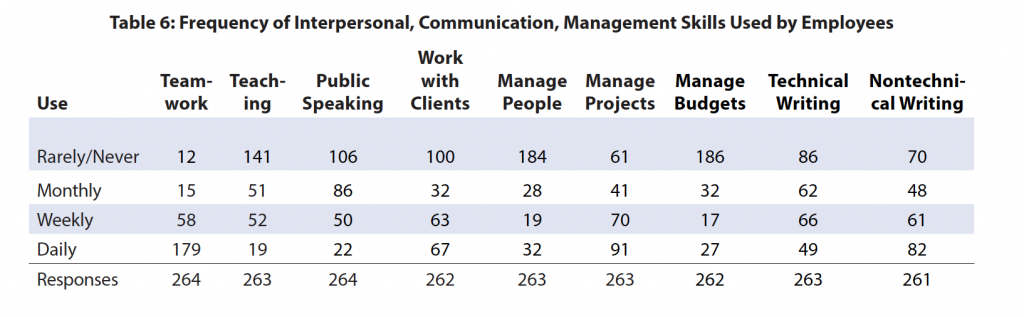
The questionnaire also asked those employed about the frequency of many skills they use in their work. Consistent with the survey of the 2016 graduates, the most used technical skills—as shown in Table 5—are technical problem-solving and data analysis. Managing and querying databases are two skills added for the survey of 2017 graduates and are roughly in the same category with quality control, programming, and statistics/advanced math. Experimental and survey design are the least-used technical skills. For interpersonal, communication, and management skills (Table 6), teamwork is by far the most often and widely used skill, followed by working with clients, project management, and writing.

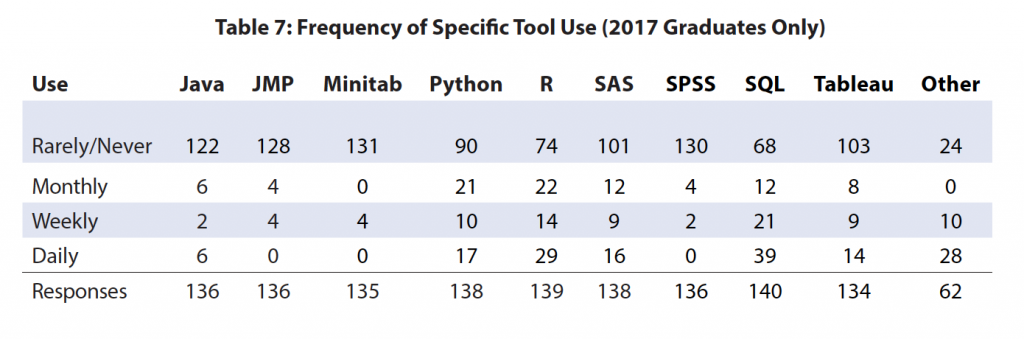
To understand the tools/languages new bachelor’s graduates use, a new question for the 2017 survey revealed relatively modest use at least weekly by those providing answers: SQL (43% used weekly or daily), R (31%), Python (20%), SAS (18%), and Tableau (17%). Thirty-eight respondents reported weekly or daily use of other tools, the most common being Excel (11). If one includes monthly use, R draws almost equal to use of SQL. See Table 7.
Postgraduate Study
One hundred fifty-three respondents reported being in a graduate program, 54 in statistics, 29 in biostatistics, 27 in data science, and 43 others in 15+ other programs—medicine, computer science, economics, and education being the most common with six, five, five, and five, respectively. Compared to the 2016 graduates, there seems to be more interest in biostatistics and data science for the 2017 graduates. Thirty-two of the graduates were enrolled in doctoral programs, 110 in master’s, though 54 of the students intend to earn a doctorate. Among the respondents who had accepted employment, 54 said they plan to enroll in a degree program in the next two to three years—25 in a doctoral program and 27 in a master’s program.
For the 72 graduates who reported a teaching or research assistant or fellowship as their primary support, the median annual stipend was $19.0K (25th percentile: $12.9K, 75th: $26.3K).
With the survey on a firm setting after two consecutive years of experience, the ASA intends to make this a biannual survey, with the next survey expected to be in 2020 for the 2019 graduates. We are also seeking to implement a survey of master’s students. (The American Mathematical Society does an annual survey of doctoral students in the mathematical sciences.)
Good to Know
The survey was conducted by the Statistical Research Center of the American Institute of Physics (AIP). The ASA provided department names and contacts for the departments granting statistics or biostatistics degrees according to our records.
For the survey of 2016 graduates, they reached out to 123 departments, 41 of which provided names and email addresses of their 2015–2016 academic year graduates. The AIP received the names and contact information for 1,017 2016 graduates.
For the survey of 2017 graduates, they again reached out to 123 departments, 44 of which provided names and email addresses of their 2016–2017 academic year graduates. The AIP received the names and contact information for 1,200 2017 graduates.
For both years, AIP reached several dozen departments that didn’t provide names and contact information to distribute the survey to their graduates.
Read the report on the ASA survey of 2016 graduates.
Supplemental Material


 (No Ratings Yet)


