Highlights from 2017 Degree Release: Bachelor’s Numbers Close in on Master’s
Steve Pierson, ASA Director of Science Policy
Progress Made for Hispanic/Latino Representation in Undergraduate Degrees
The ratio of the number of master’s degrees to that of bachelor’s closed to 1.2 in 2017, the closest it’s been since 1987 when it was also 1.2. The ratio grew to around 2.5 in the mid 2000s.
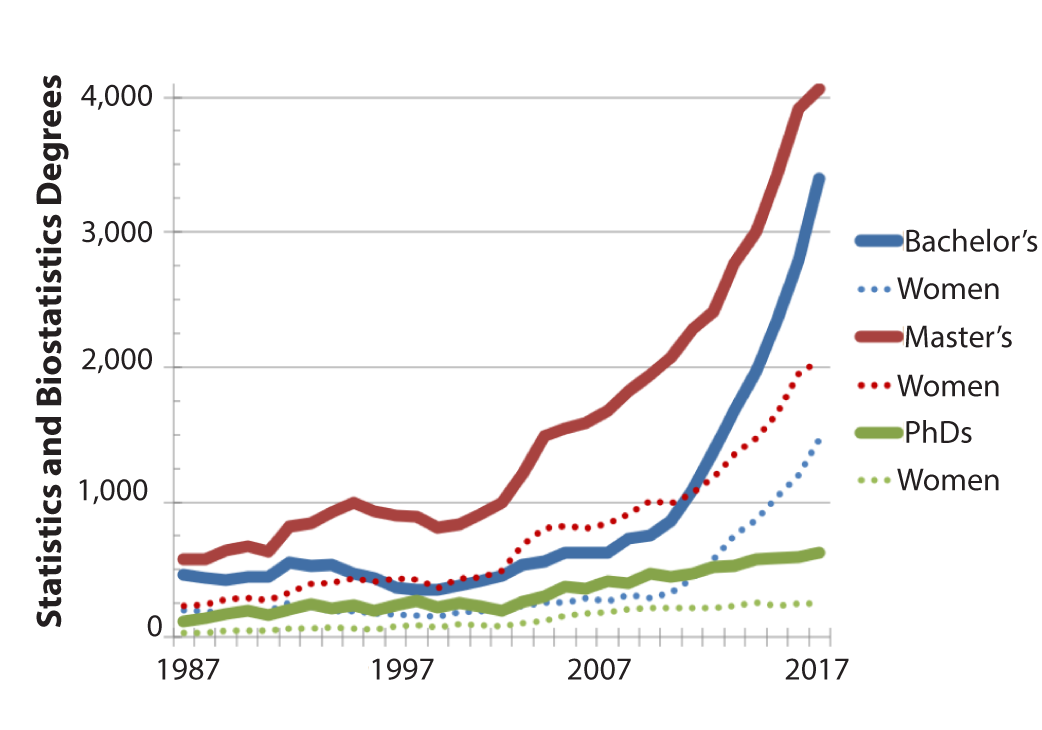
Figure 1
Statistics and biostatistics degrees at the bachelor’s, master’s, and doctoral levels in the United States. The dotted lines of matching colors are the number of degrees for that degree level earned by women. Data source: NCES IPEDS.
According to the latest preliminary data release from the National Center for Education Statistics, bachelor’s degrees, from 2016 to 2017, grew 22% to 3,398 (36 of which are for biostatistics) and master’s degrees increased 4% to 4,059 (693 for biostatistics). Doctoral degrees increased by 5% to 620 (201 for biostatistics), as seen in Figure 1, with the dotted lines showing the associated number of degrees earned by women.
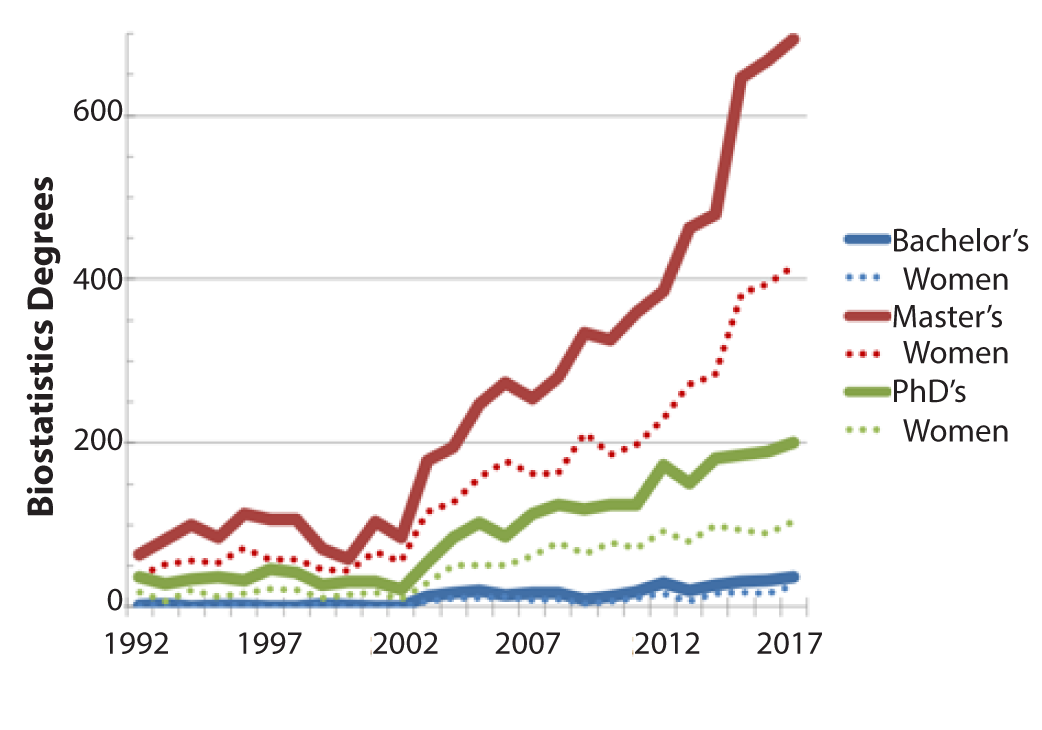
Figure 2
Biostatistics degrees by degree level awarded in the United States. The dotted lines on matching colors are the number of degrees for that degree level earned by women.
Figure 2 shows the comparable data for only biostatistics degrees.
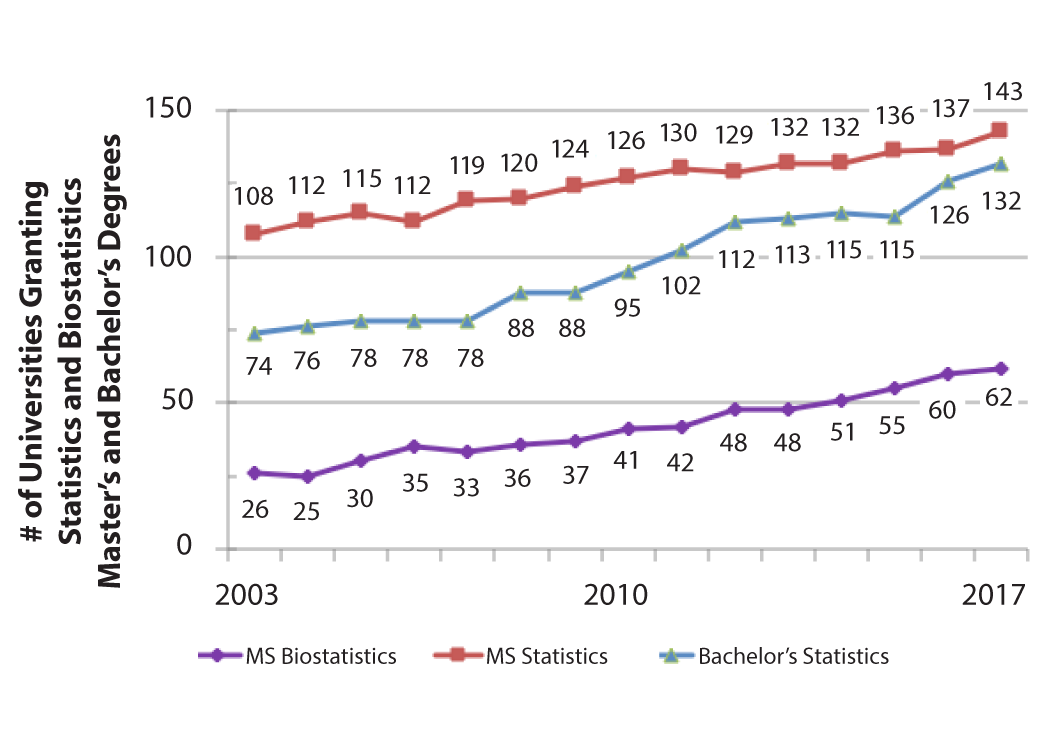
Figure 3
The number of universities granting statistics and biostatistics master’s and bachelor’s degrees. Compiled from NCES IPEDS data.
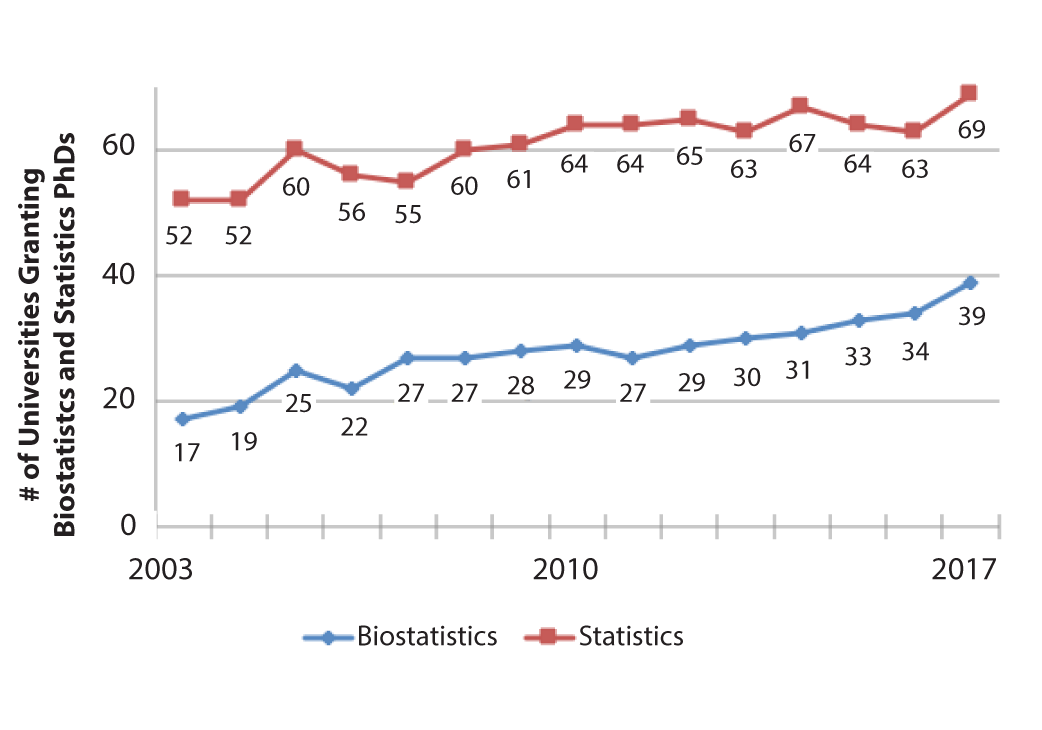
Figure 4
The number of universities granting statistics and biostatistics PhDs. Compiled from NCES IPEDS data.
Accompanying this growth is an increase in the number of universities granting bachelor’s degrees in statistics (from 126 to 132), master’s degrees in statistics (137 to 143), doctoral degrees in biostatistics (34 to 39), and doctoral degrees in statistics (69 from a previous high of 67 in 2014), as seen in Figures 3 and 4.
There are 23 universities granting statistics and biostatistics degrees for the first time (at least since 2003) in 2017:
- Bachelor’s degrees in biostatistics (1): Carnegie Mellon University
- Bachelor’s degrees in statistics (7): Emory University, Muhlenberg College, Penn State University-Harrisburg, University of Michigan-Dearborn, University of Washington-Tacoma, Utah Valley University, Valparaiso University
- Master’s degrees in statistics (7): Central Michigan University, CUNY Queens College, Michigan Technological University, Texas A&M University-Kingsville, University of Houston-Downtown, University of Colorado Denver/Anschutz Medical Campus, University of Kansas
- Master’s degrees in biostatistics (3): Medical University of South Carolina, New York Medical College, University of Connecticut
- PhD in biostatistics (2): University of Miami, Vanderbilt University
- PhD in statistics (3): Boston University, University of Texas at Austin, West Virginia University
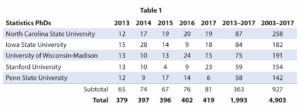
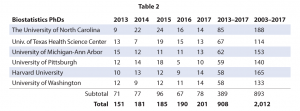
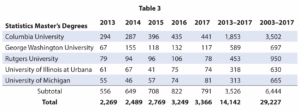
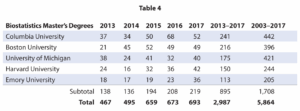
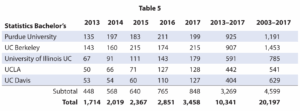
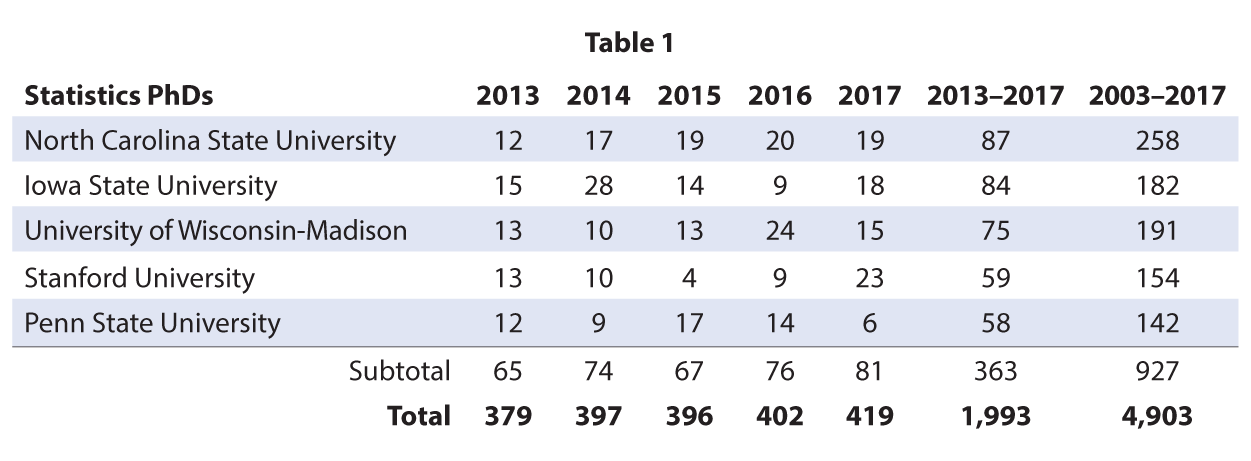
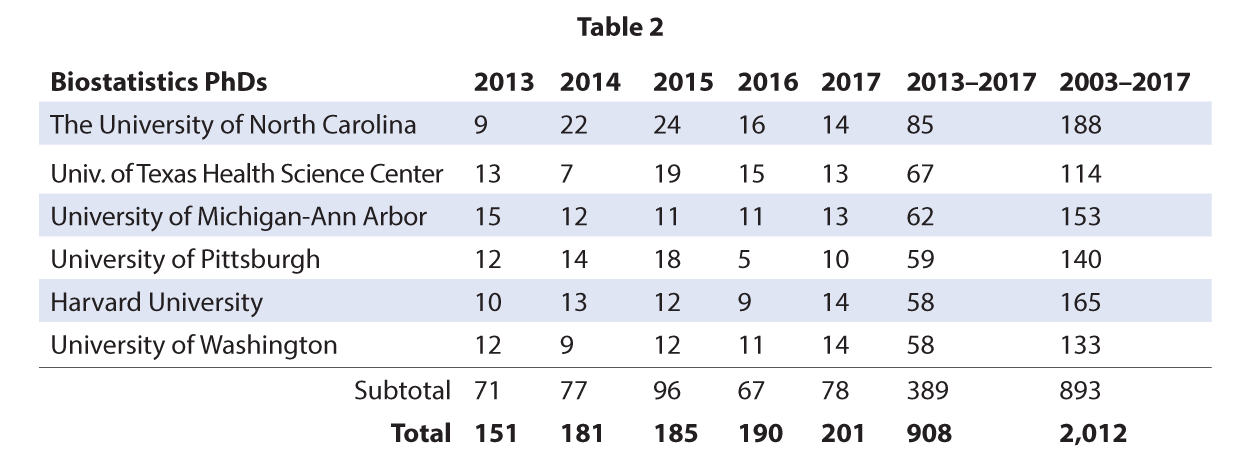
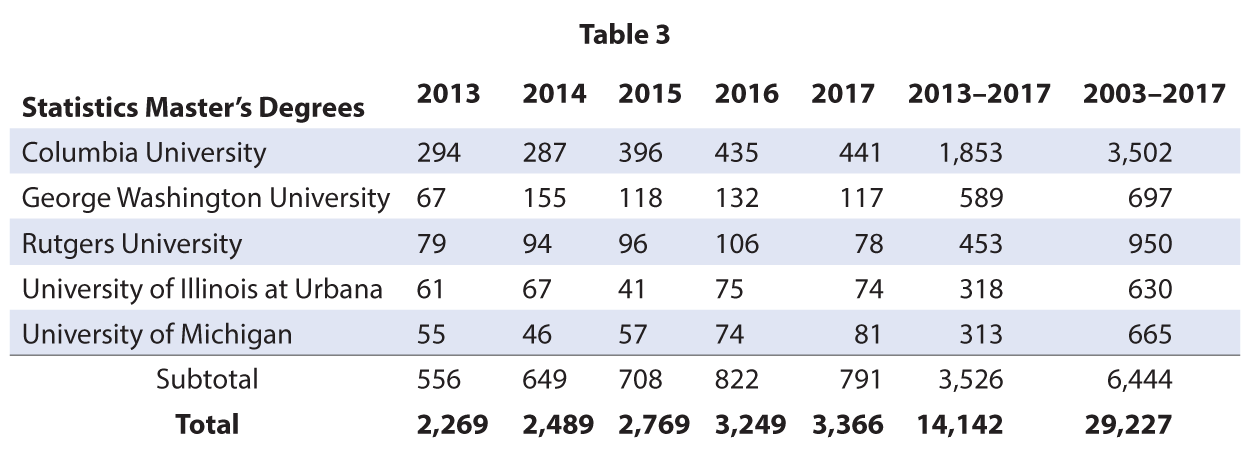
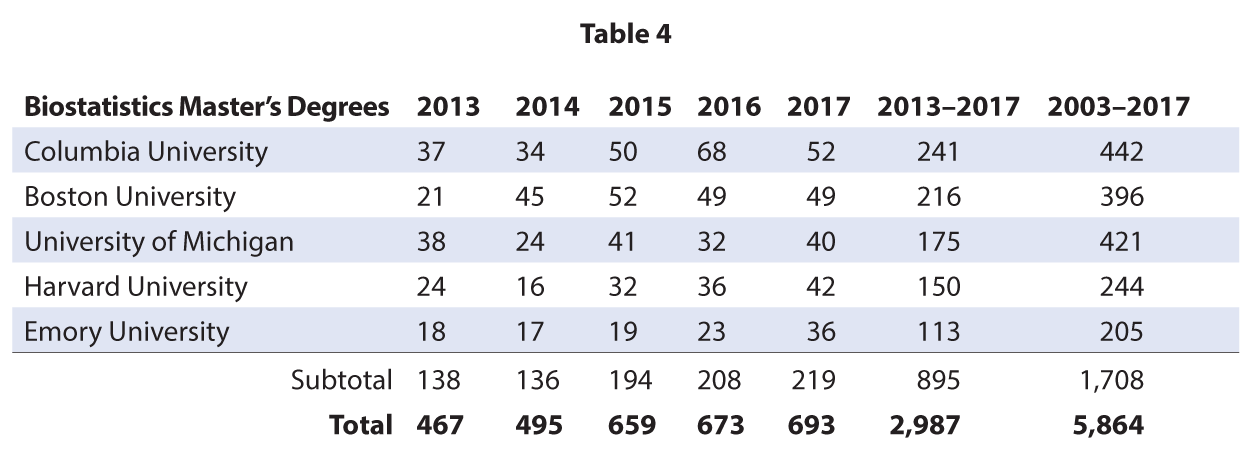
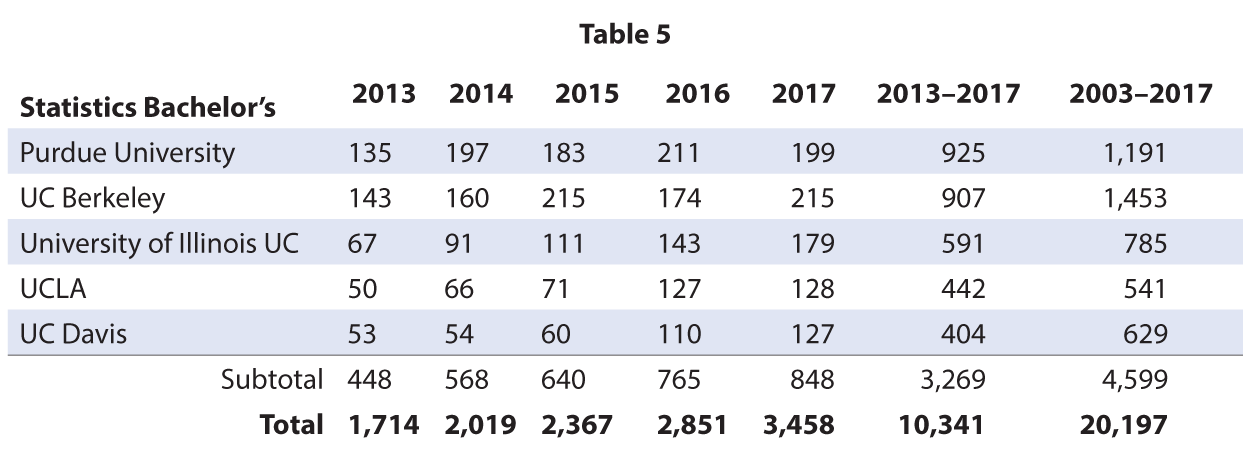
Tables 1–5: Top five universities granting statistics and biostatistics degrees for 2013–2017.
The top degree-granting institutions over the last five years are in Tables 1-5 for all categories except biostatistics bachelor’s degrees. A comprehensive list is available at on the ASA website.
DemographicsFollowing our practice of alternating demographics updates, we look at the breakdown of degrees for race and ethnicity data and resident aliens and US citizens or residents this year.
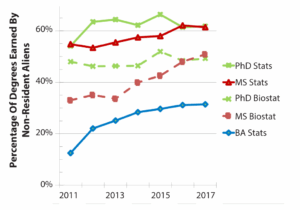
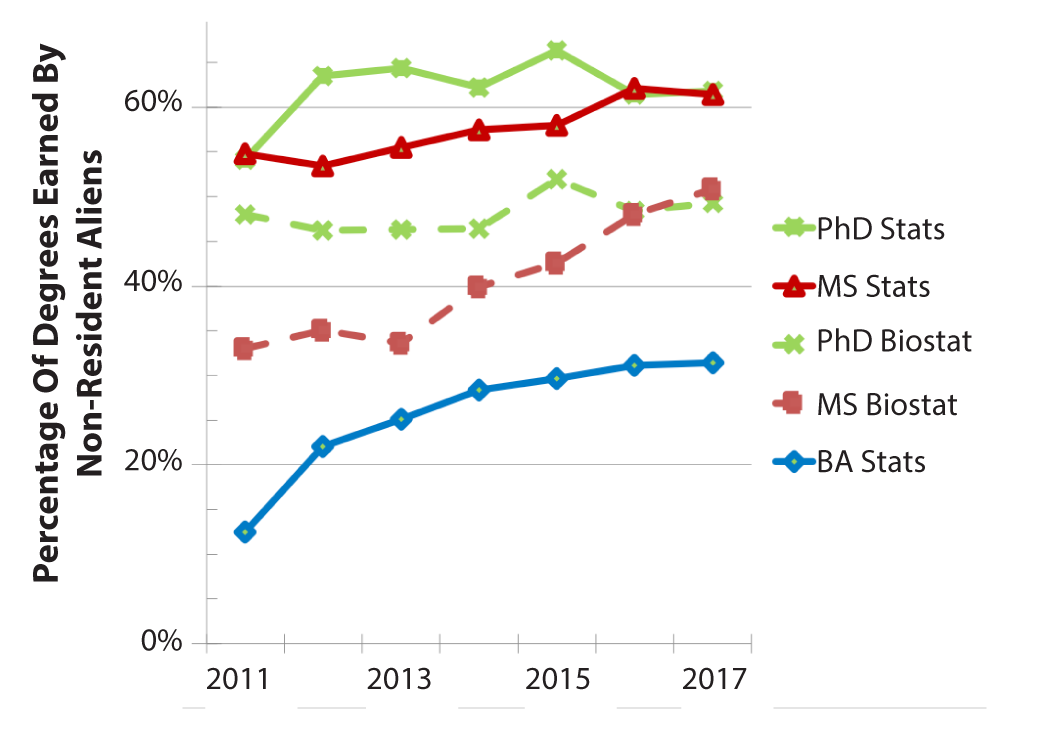
Figure 5
Percentage of statistics and biostatistics degrees earned by nonresident aliensAs shown in Figure 5, the percentage of master’s and doctoral degrees in statistics awarded in recent years to nonresident aliens is approximately 60%. For the same degree levels in biostatistics, it is closer to 50%, while it has grown to about 31% for bachelor’s degrees in statistics. The percentages seem generally stable for doctoral-level degrees and on the increase for master’s and bachelor’s degrees, more so for master’s degrees in biostatistics.
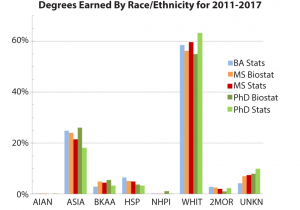
Figure 6
Degrees earned by NCES race/ethnicity group and degree level, averaged over 2011–2017, as a percentage of degrees earned by US citizens or residentsFigure 6 shows race and ethnicity data for the degrees granted to US citizens or residents averaged for 2011–2017. (NCES does not report race/ethnicity data for nonresident aliens.) For the five degrees for this subset of the data (except biostatistics bachelor’s for which the numbers are small), the percentage of degrees earned by those who report their race as American Indian or Alaska Native (AIAN) is essentially 0%. For those identifying as Asian (ASIA), the percentage is around 20%; it is 3–6% for those identifying as black or African American (BKAA). The percentage for individuals of Native Hawaiian or Other Pacific Islander (NHPI) descent is 0–1%. The percentage for those who identify as White (WHIT) is near 60% and 2% for individuals who report two or more races (2MOR). For those identifying ethnicity as Hispanic or Latino (HISP), the percentage is 3–7%. Finally, the percentage for those reporting race/ethnicity unknown (UNKN) is 4–9%.
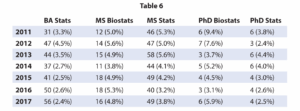
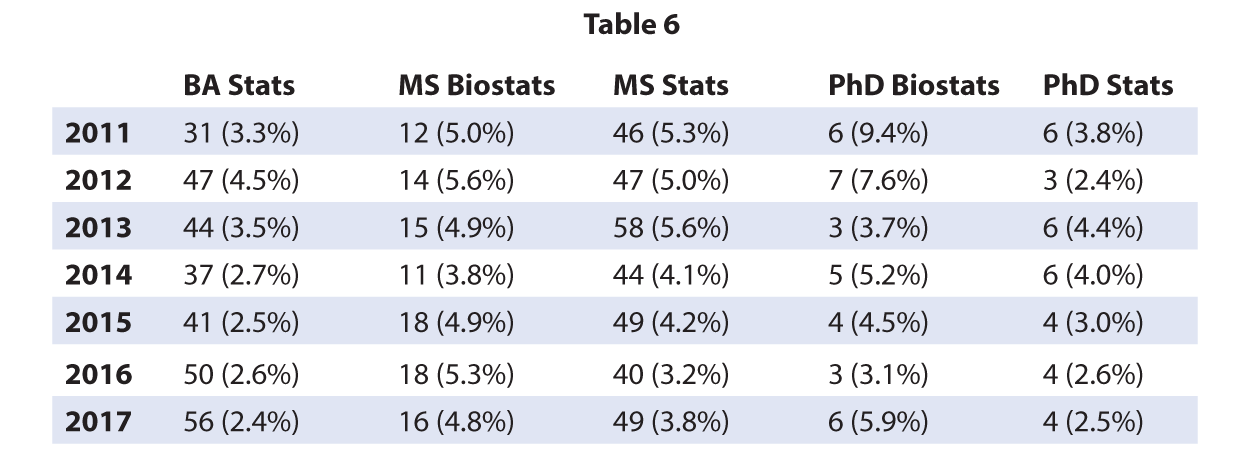
Number of degrees awarded to African Americans or blacks who are US citizens or permanent residents by degree level. The percentage is the number compared to total number of degrees for that year awarded to US citizens or permanent residents.
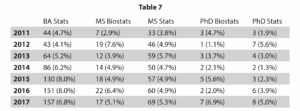
Number of degrees awarded to Hispanics or Latinos who are US citizens or permanent residents by degree level. The percentage is the number compared to total number of degrees for that year awarded to US citizens or permanent residents.
To better understand the percentages in Figure 6, consider Tables 6 and 7, which show numbers for two under-represented minorities. At the graduate level, for African Americans or blacks who are US citizens or permanent residents, the number of degrees awarded is stable, but the percentage of the degrees awarded to US citizens or permanent residents is generally declining. For the bachelor’s level, there seems to be an increase in number, but it’s declining as a percentage of overall degrees earned by US citizens or permanent residents.
For Hispanics or Latinos, there again appears not to be any increase in numbers for any degree level except for bachelor’s and perhaps master’s in statistics. For the former, the increase seems to track—if not surpass—the 145% increase in bachelor’s degrees in statistics earned by US citizens or permanent residents from 2011 (943) to 2017 (2,307). In a closer examination of this trend, there were eight institutions that granted more than 10 bachelor’s degrees in statistics in 2016 and 2017 to students identifying in this ethnic group, amounting to 40% of the total 308 for these two academic years. Seven of the institutions were from California and Florida—University of California (UC) at Santa Barbara, UCLA, University of Florida, San Diego State University, Florida State University, UC-Davis, and UC-Berkeley—with Purdue University being the other institution.
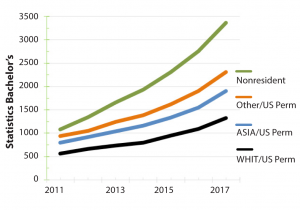
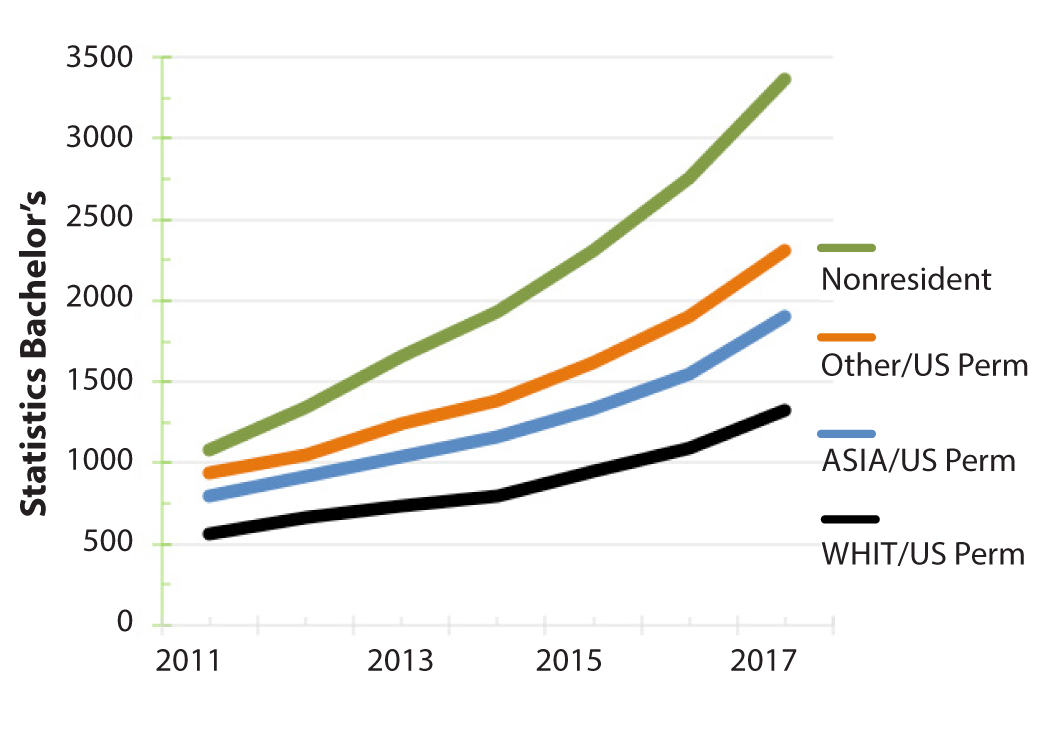
Figure 7
Bachelor’s degrees in statistics for the years 2011–2017 by race/ethnicity for US citizen/residents and nonresident aliens. “Other” includes BKAA, HISP, AIAN, NHPI, 2MOR, and UNKN.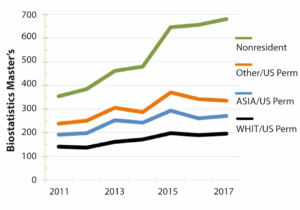
Figure 8
Master’s degrees in biostatistics for the years 2011–2017 by race/ethnicity for US citizen/residents and nonresident aliens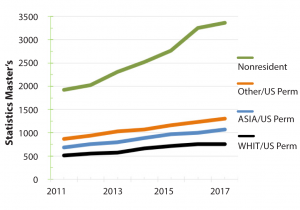
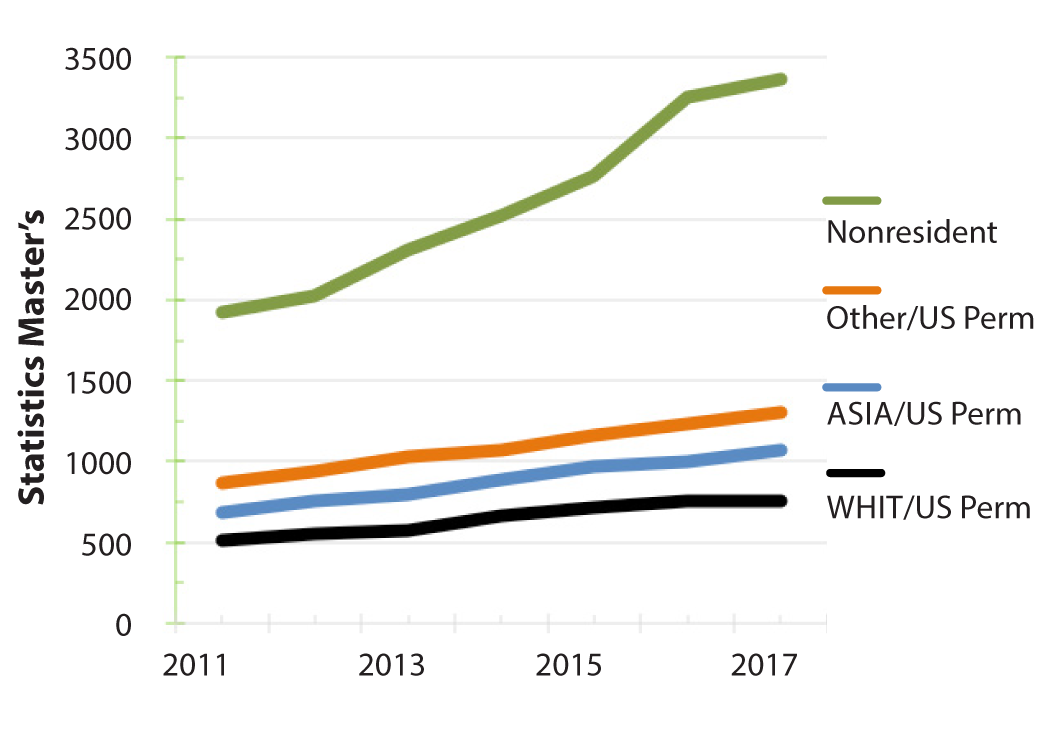
Figure 9
Master’s degrees in statistics for the years 2011–2017 by race/ethnicity for US citizen/residents and nonresident aliens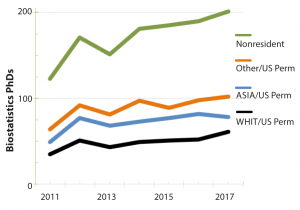
Figure 10
Doctoral degrees in biostatistics for the years 2011–2017 by race/ethnicity for US citizen/residents and nonresident aliens
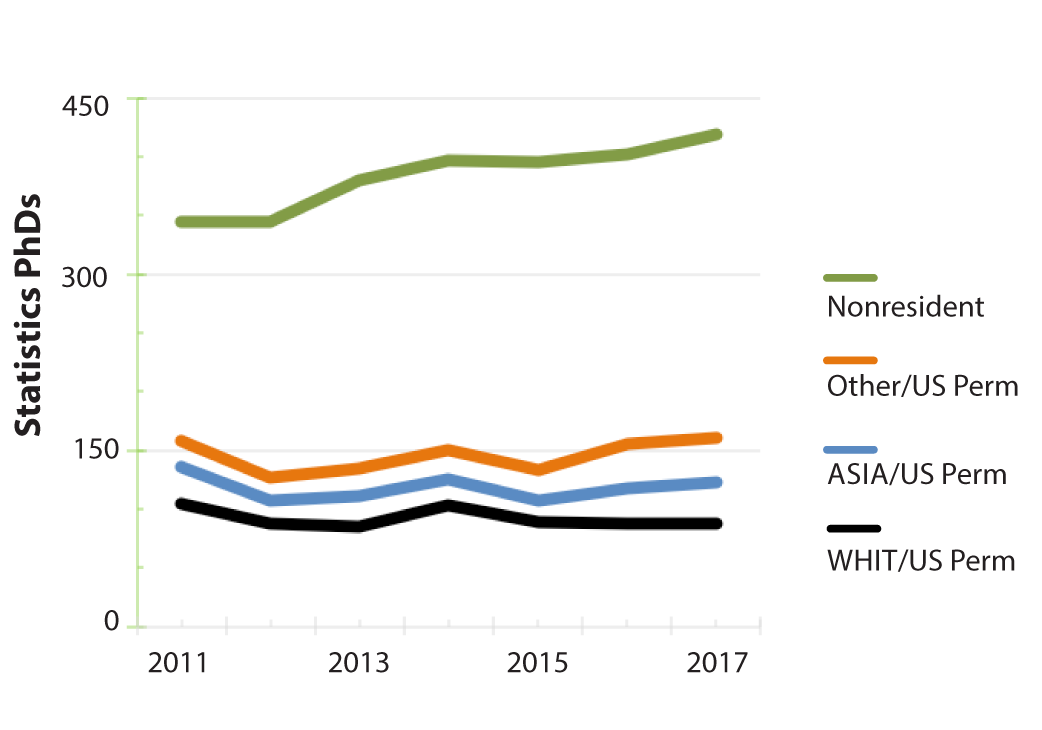
Figure 11
Doctoral degrees in statistics for the years 2011–2017 by race/ethnicity for US citizen/residents and nonresident aliensTo further understand the growth in statistics and biostatistics degrees, we show the degree growth from 2011–2017 for five degree categories in Figures 7–11. For bachelor’s degrees in statistics (Figure 7), the degree growth is substantial for each of the four categories. Within the “Other” category—as shown in Tables 6 and 7—there is strong growth for African Americans or blacks and Hispanics or Latinos. There is also notable growth for two or more races, increasing from 8 in 2011 to 92 in 2017. As another way to represent the growth in numbers for this degree level from 2011–2017, 40% is due nonresident aliens, 33% for white US citizens/residents, 15% for Asian US citizens/residents, 5% for Hispanic/Latino US citizens/residents, 1% for black/African American US citizens/residents, 4% for US citizens/residents of 2 or more races, and 2% for US citizens/residents of unknown race.
For master’s degrees in biostatistics, 70% of the growth from 2011–2017 is for nonresident aliens, 17% for white US citizens/residents, 8% for Asian US citizens/residents, and 3% for Hispanic/Latino US citizens/residents (Figure 8).
For master’s degrees in statistics, 70% of the growth is for nonresident aliens, 17% for white US citizens/residents, 9% for Asian US citizens/residents, and 2% for Hispanic Latino US citizens/residents (Figure 9).
For doctoral degrees in biostatistics, 51% of the growth is for nonresident aliens; 33% for white US citizens/residents, 4% for Asian US citizens/residents, 5% for Hispanic/Latino US citizens/residents, 4% for US citizens/residents of 2 or more races, and 4% for US citizens/residents of unknown race (Figure 10).
For doctoral degrees in statistics, 97% of the growth is for nonresident aliens, -23% for white US citizens/residents, 5% for Asian US citizens/residents, 7% for Hispanic/Latino US citizens/residents, -3% for black/African American US citizens/residents, 11% for US citizens/residents of 2 or more races, and 4% for US citizens/residents of unknown race (Figure 11).
For percentage of degrees earned by women in 2017, the level held steady at 43% for bachelor’s degrees in statistics, about 49% for master’s degrees in statistics, 60% for master’s degrees in biostatistics, and 52% for PhDs in biostatistics. For PhDs in statistics, the percentage was down a few points to 34%. For a more complete analysis based on gender, last year’s update is available in the August 2016 issue of Amstat News.


 (No Ratings Yet)


Interesting!
There’s two other questions that would be useful to report:
1. Quality. Are we producing *better* statisticians? How would we know?
2. This report covers supply, but what about demand? How have statistics degrees scaled with job demand? Does the rise in post-docs suggest we have more supply than demand? Industry is harder, since students are competing against other degrees (e.g. math, physics) and other credentialing services (e.g. Coursera) for “data-science” jobs.