Strong Growth for Statistics and Biostatistics Degrees Continues Through 2019
Steve Pierson, Director of Science Policy
The decade of statistics continued with robust growth in the number of statistics and biostatistics degrees awarded annually at the bachelor’s and master’s levels. According to the latest preliminary data release from the National Center for Education Statistics (NCES), bachelor’s degrees grew 13 percent from 2018 to 2019 to 4,472 (44 of which are for biostatistics) and master’s degrees increased 7 percent to 4,515 (768 for biostatistics), as seen in Figure 1. Doctoral degrees decreased by 4 percent to 688 (186 for biostatistics).
(Please click on the images to view the full-size figures.)
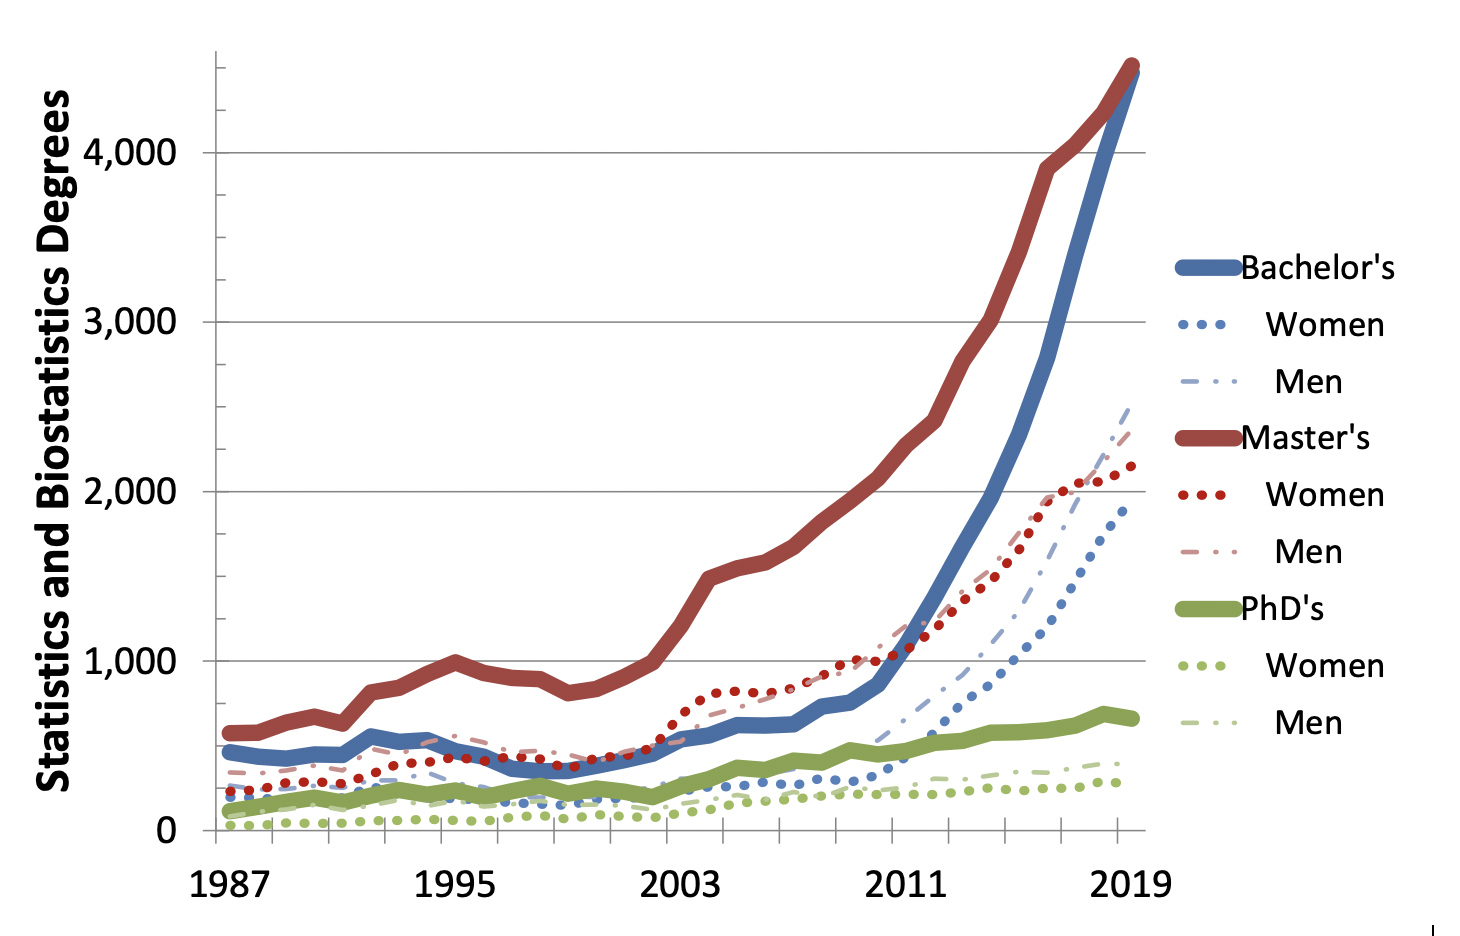
Figure 1. Statistics and biostatistics degrees at the bachelor’s, master’s, and doctoral levels in the United States for 1987–2019. Data source: NCES IPEDS
While the growth of bachelor’s degrees is dominated by statistics—and the overall number of master’s and doctoral degrees is three to five times greater for statistics than biostatistics—the percentage growth in graduate degrees for both fields are roughly similar since 2010, as seen in Figures 2 and 3.
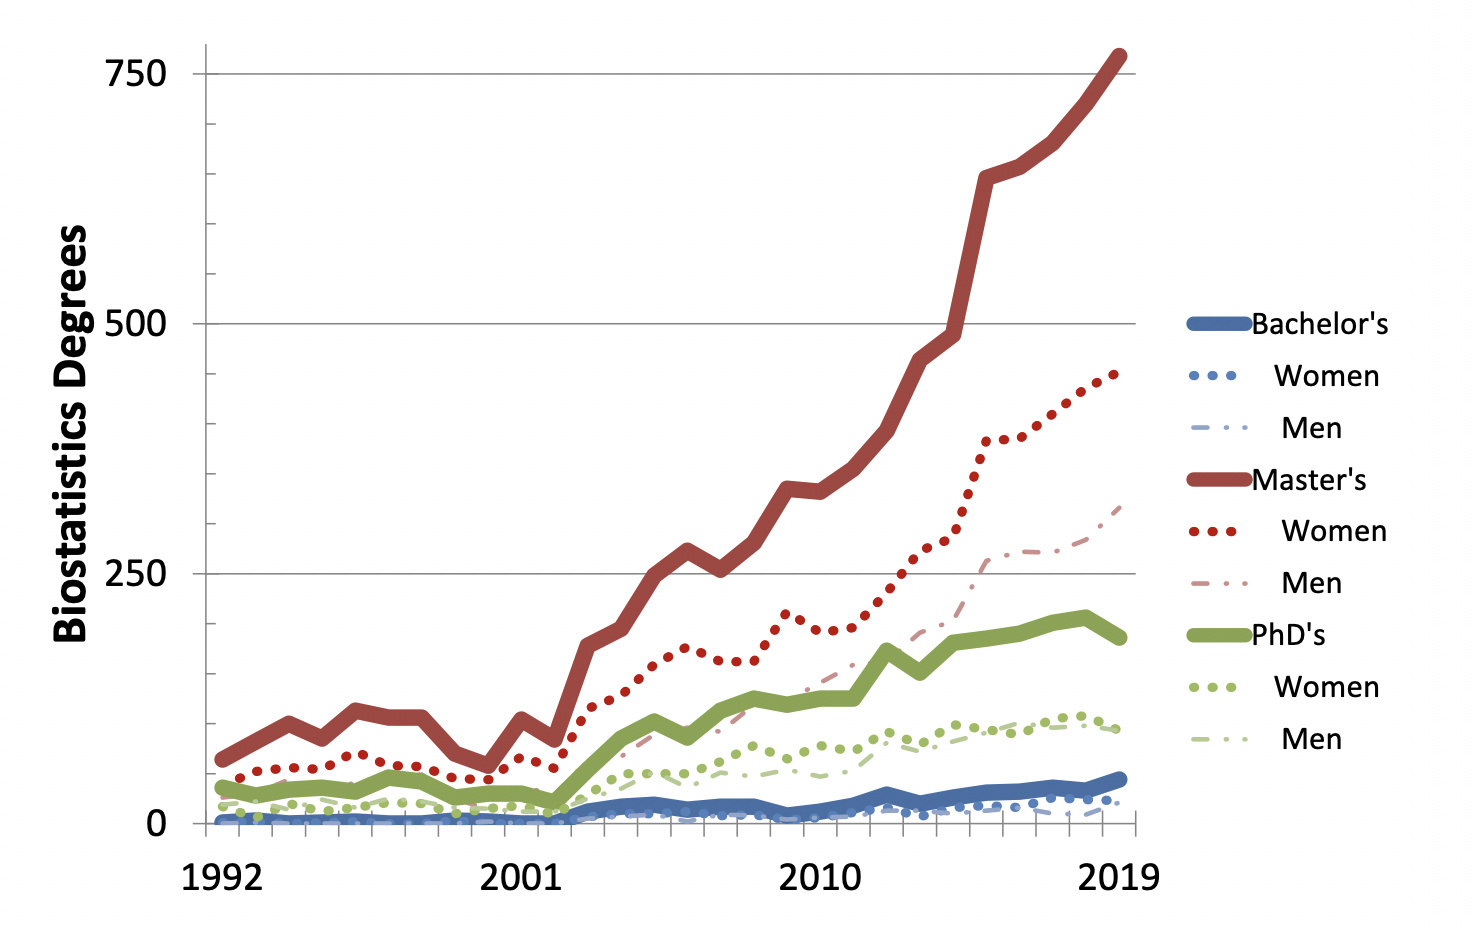
Figure 2. Biostatistics degrees by degree level awarded in the United States
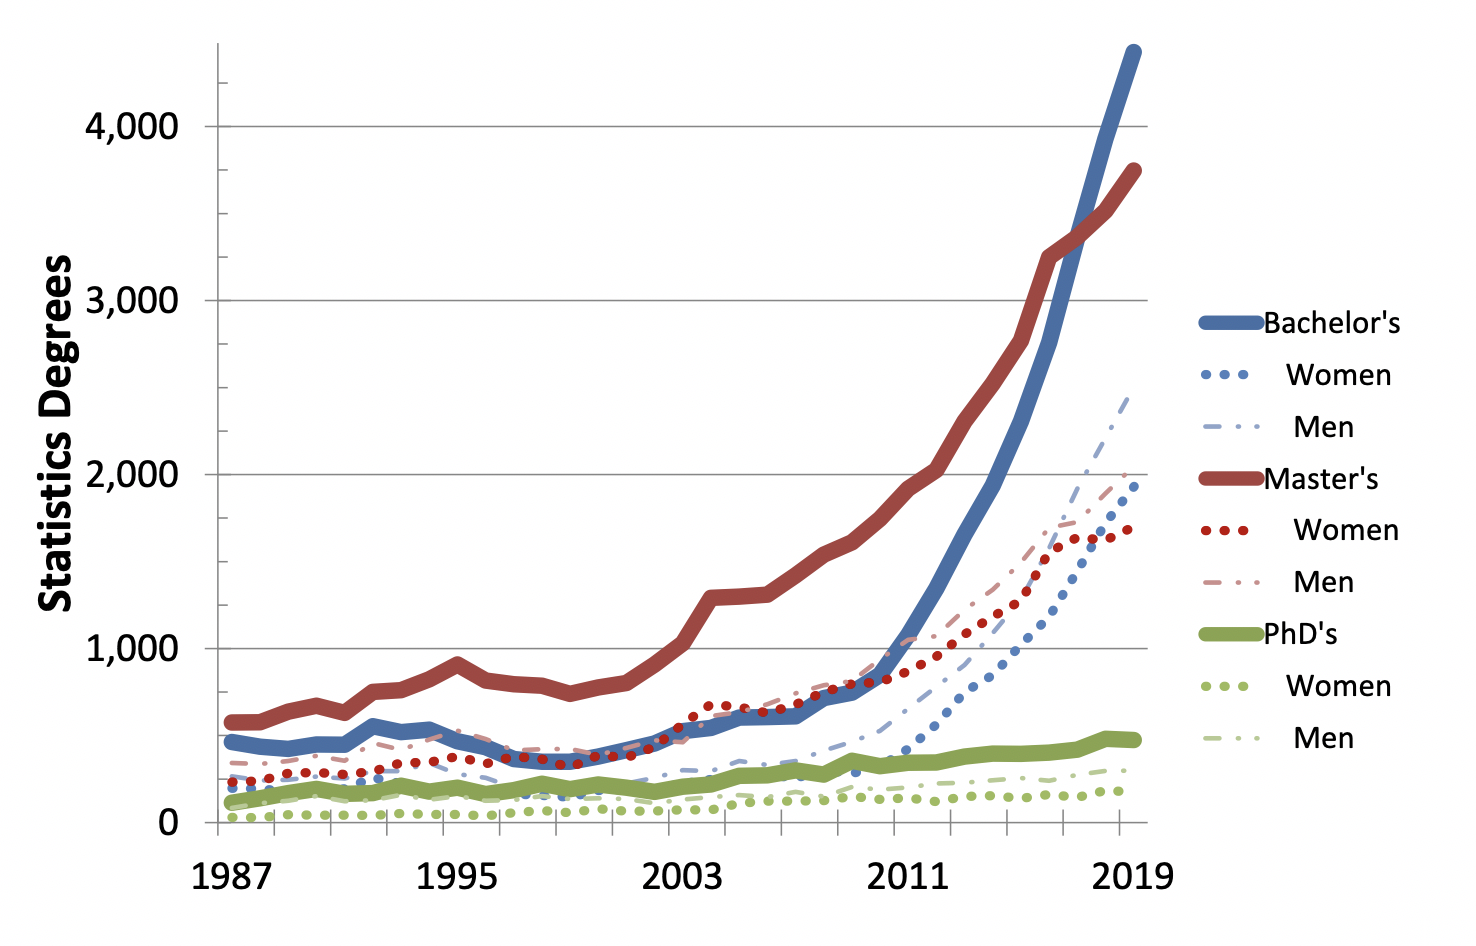
Figure 3. Statistics degrees by degree level awarded in the United States
The increase in the number of universities granting statistics and biostatistics degrees also continues steadily—even at the doctoral level, despite the latest year’s drop. For the period from 2018 to 2019, those granting bachelor’s degrees in statistics increased from 138 to 152, master’s degrees in statistics from 146 to 152, and doctoral degrees in statistics from 72 to 74, as seen in Figures 4 and 5. For biostatistics, eight, 66, and 41 universities granted degrees in 2018 at the bachelor’s, master’s, and doctoral levels, respectively. Twenty-six universities granted statistics and biostatistics degrees for the first time (at least since 2003) in 2019:
- Bachelor’s degrees in biostatistics (1): Indiana University-Purdue University-Indianapolis
- Bachelor’s degrees in statistics (14): Butler University, California University of Pennsylvania, Calvin University, Emmanuel College, Florida Southern College, George Mason University, Misericordia University, New York University, Northwest Missouri State University, Robert Morris University, South Dakota State University, Temple University, University of Evansville, University of Houston, University of Idaho
- Master’s degrees in statistics (6): Binghamton University, Johns Hopkins University, University of California-Santa Cruz, University of Houston, the University of Illinois at Chicago, University of North Texas
- Master’s degrees in biostatistics (2): Temple University, University of Mississippi
- PhD in statistics (3): Michigan Technological University, Washington State University, Worcester Polytechnic Institute
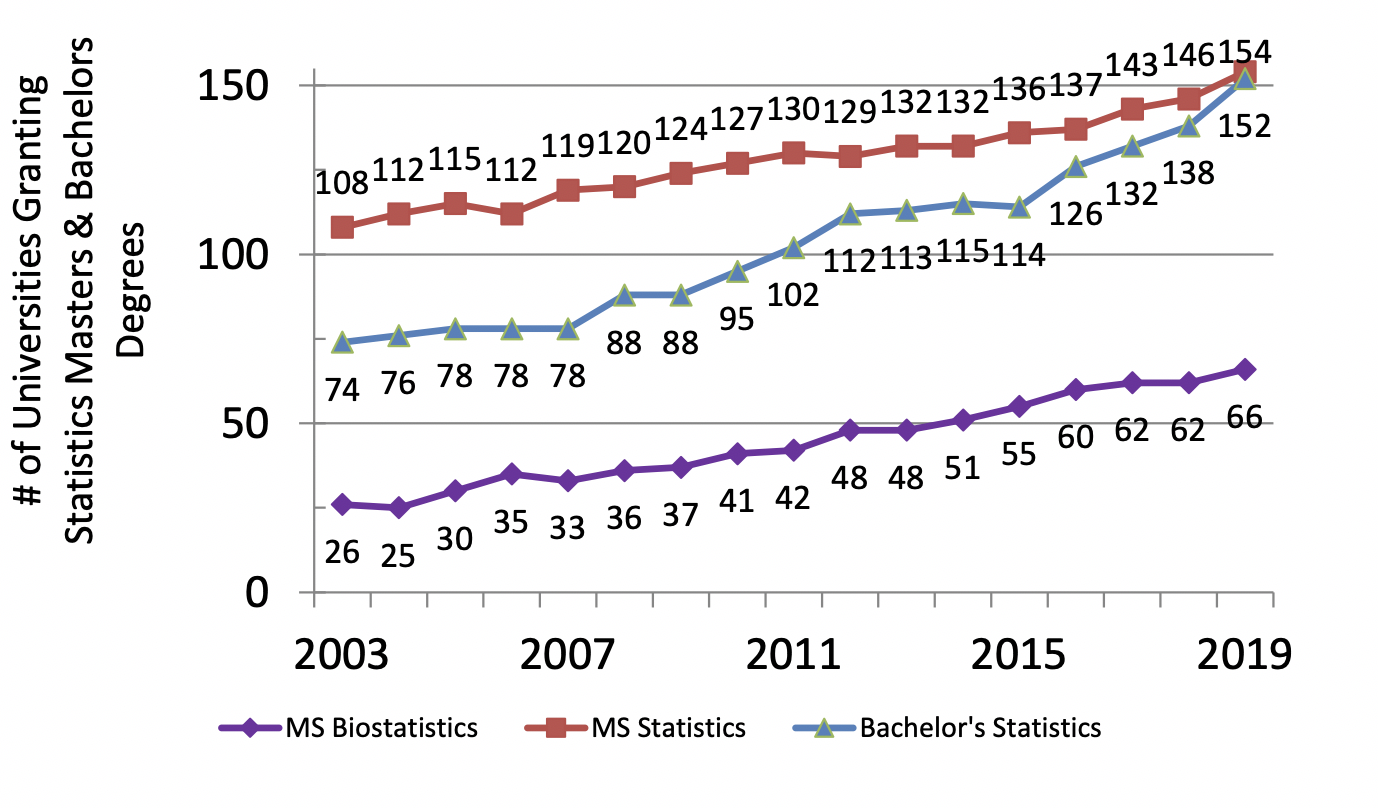
Figure 4. The number of universities granting statistics and biostatistics master’s and bachelor’s degrees. Compiled from NCES IPEDS data.
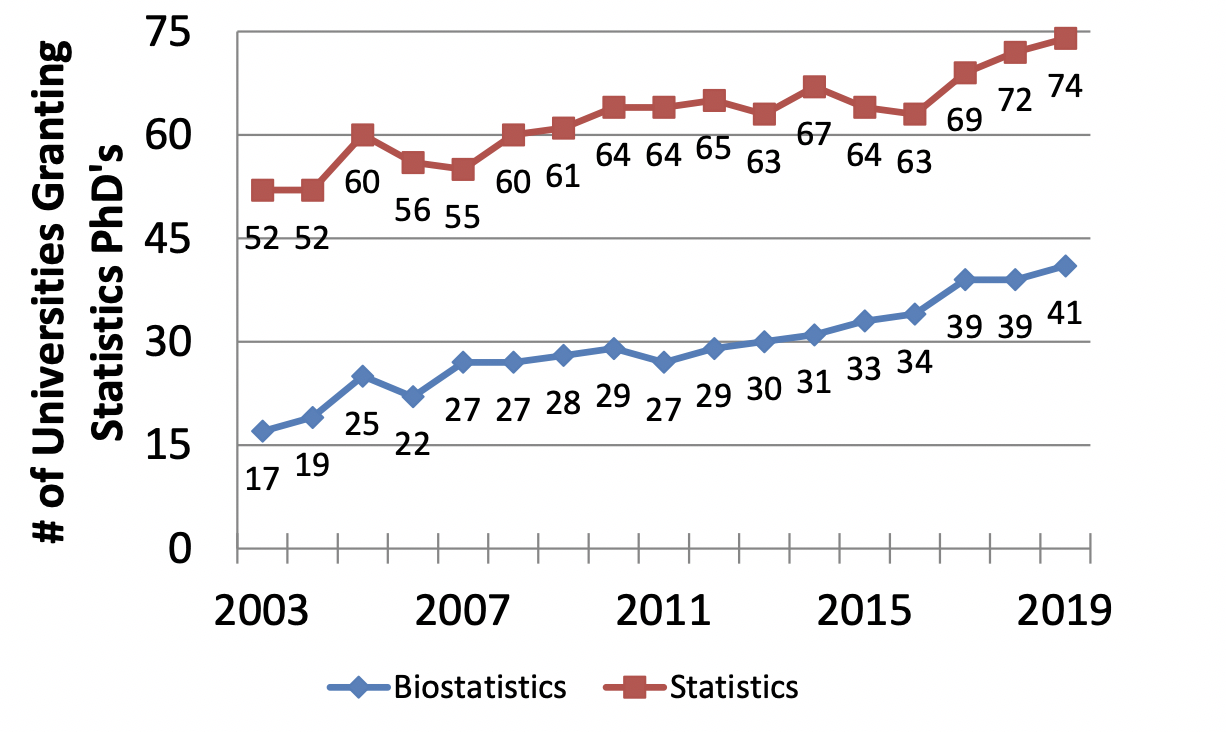
Figure 5. The number of universities granting statistics and biostatistics PhDs. Compiled from NCES IPEDS data.

Tables 1–5—Top Five Universities Granting Statistics and Biostatistics Degrees for 2015–2019
The top degree-granting institutions over the last five years are in the previous tables for all categories except biostatistics bachelor’s degrees. View the comprehensive list on the ASA website.
Demographics
Following our practice to alternate demographics updates, we look at the breakdown of degrees for race and ethnicity data and by nonresident aliens and US citizens or residents this year. Last year’s update, which was based on 2018 degree data, had figures for the percentage of statistics and biostatistics degrees earned by gender. The degree data files with degrees by gender have been updated with the 2019 data.
As shown in Figure 6, the percentage of master’s and doctoral degrees in statistics awarded in recent years to nonresident aliens is just over 60 percent. For the same degree levels in biostatistics, it is closer to 50 percent, while it has grown to about 30 percent for bachelor’s degrees in statistics. The percentages all seem generally stable over the past several years.
The NCES has race and ethnicity data for the degrees granted to US citizens or residents but does not have such data for nonresident aliens. Figure 7 shows the race and ethnicity breakdown of the US citizens and residents averaged for 2011–2019. For the five degrees—not including biostatistics bachelor’s for which the numbers are small—the percentage of degrees earned by those who report their race as American Indian or Alaska Native (AIAN) is essentially 0 percent. For those identifying as Asian (ASIA), the percentage is around 20 percent. It is 3–6 percent for those identifying as Black or African American (BKAA). The percentage for individuals of Native Hawaiian or Other Pacific Islander (NHPI) descent is 0–1 percent. The percentage for those individuals who identify as white (WHIT) is near 60 percent and, for individuals who report two or more races (2MOR), it is 2 percent. For those identifying ethnicity as Hispanic or Latino (HISP), the percentage is 3–7 percent. Finally, the percentage for those reporting race/ethnicity unknown (UNKN) is 4–9 percent.
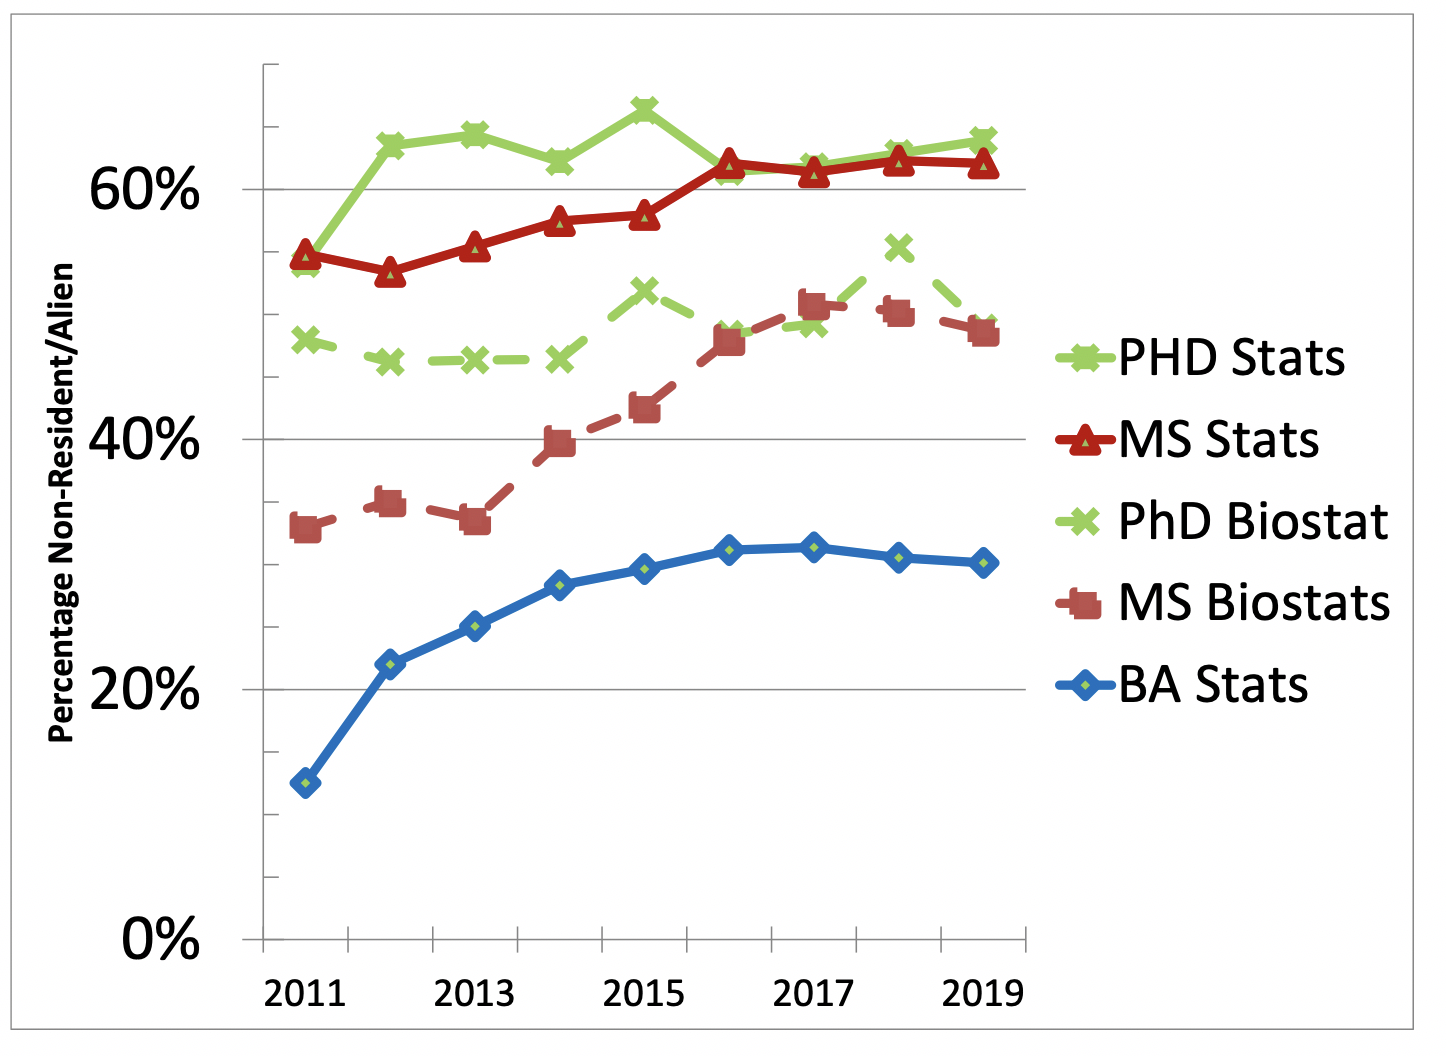
Figure 6. Percentage of statistics and biostatistics degrees earned by nonresident aliens
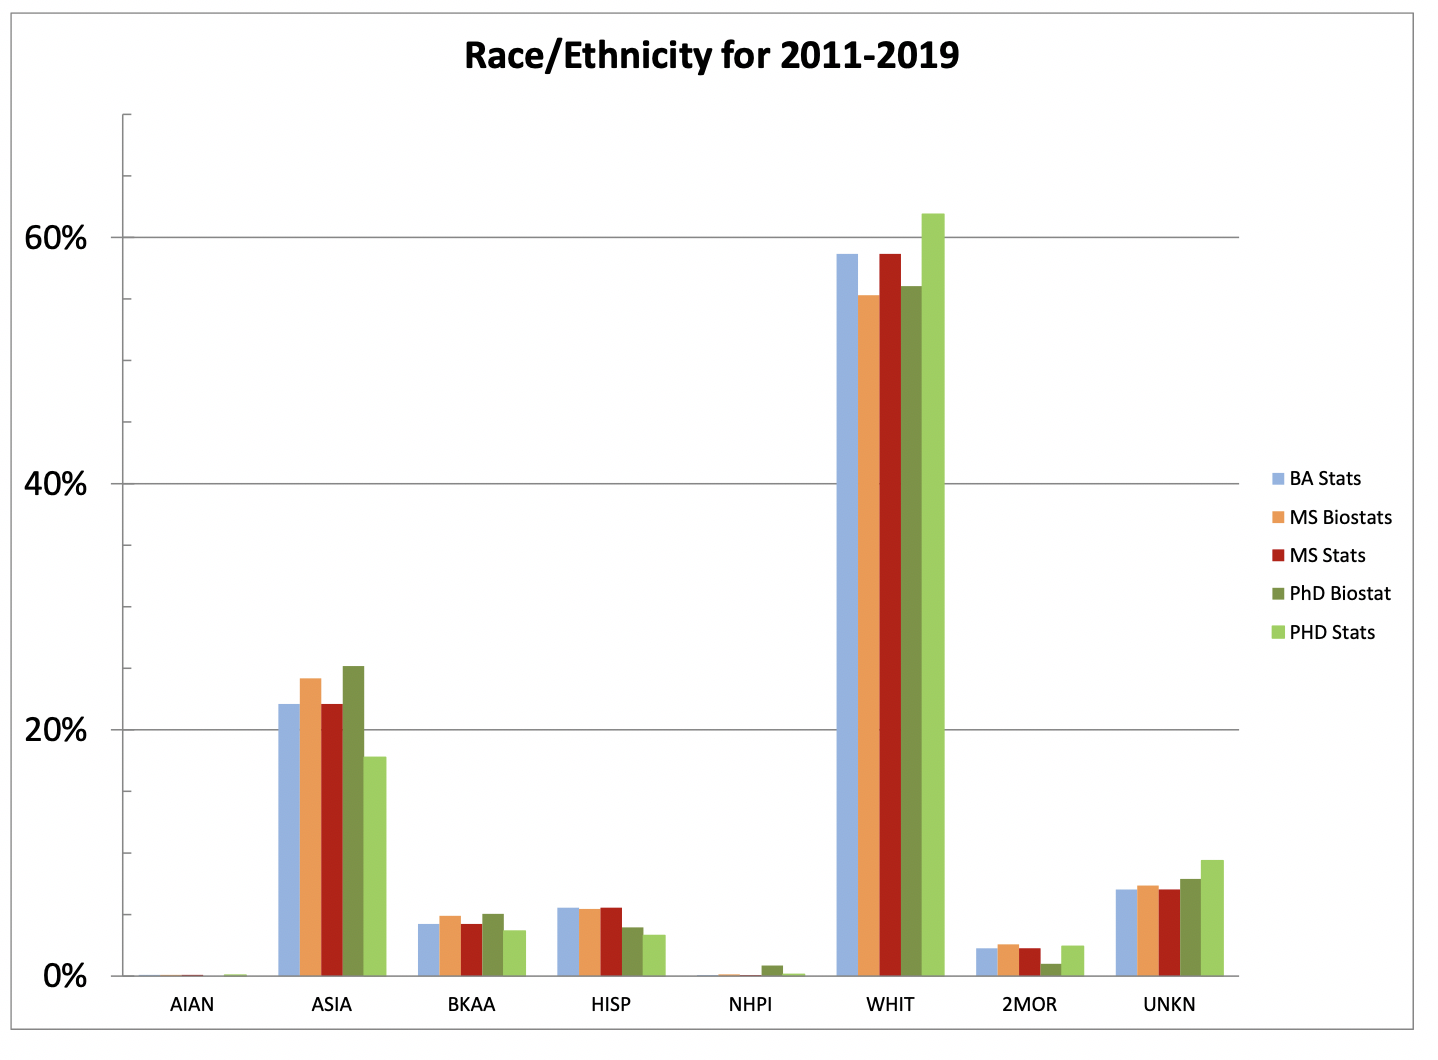
Figure 7. Degrees earned by NCES race/ethnicity group and degree level, averaged over 2011–2019, as a percentage of degrees earned by US citizens or residents
To better understand the percentages in Figure 7, consider Tables 6 and 7, which show numbers for two under-represented minorities. At the graduate level, for African Americans or Blacks who are US citizens or permanent residents, the number of doctoral degrees earned are in the single digits and seemingly a declining percentage of overall degrees awarded to US citizens or permanent residents. For the bachelor’s level, there seems to be an increase in the number of degrees, but not an increase in the percentage of overall degrees earned by US citizens or permanent residents.

Table 6—Number of Degrees Awarded to African Americans or Blacks Who Are US Citizens or Permanent Residents by Degree Level
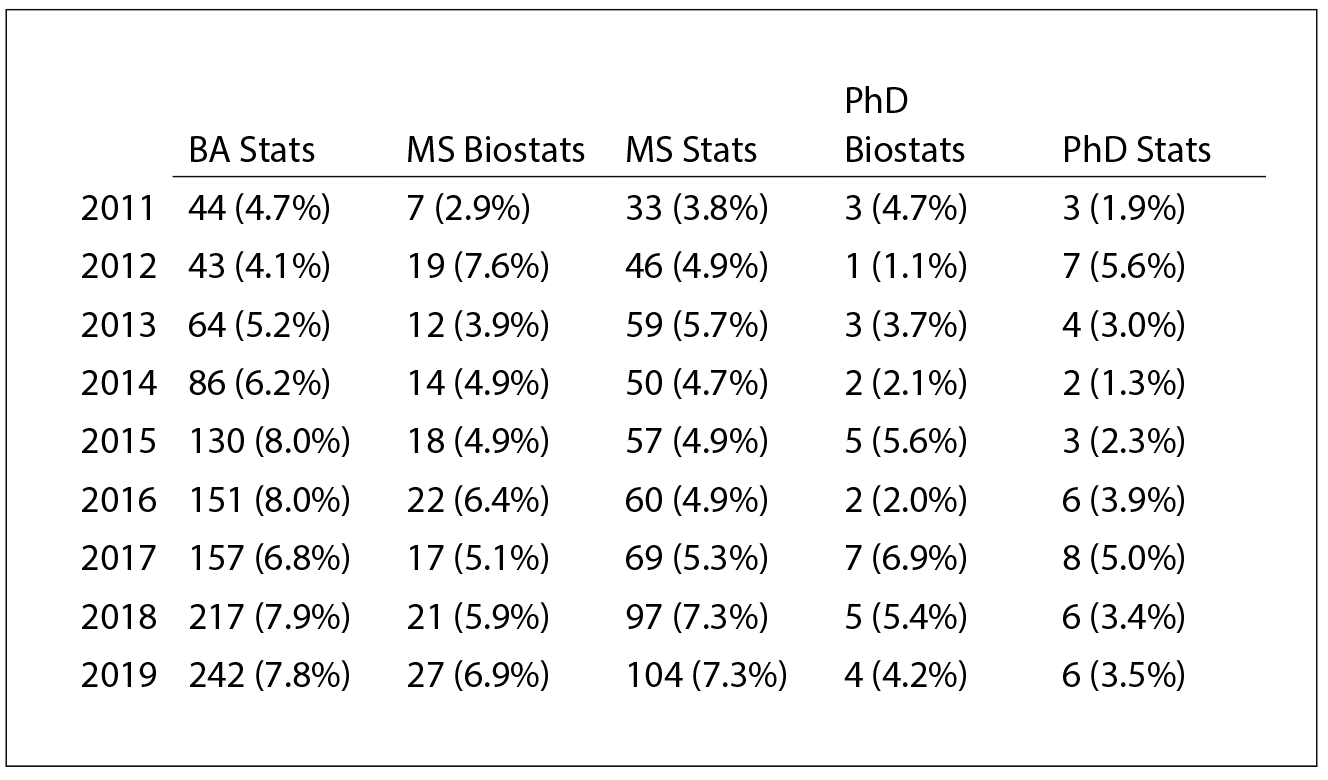
Table 7—Number of Degrees Awarded to Hispanics or Latinos Who Are US Citizens or Permanent Residents by Degree Level
For Hispanics or Latinos, the doctoral numbers are also in the single digits with little or no movement over the decade. For bachelor’s and master’s in statistics, the numbers seem to be increasing and, as a percentage, also possibly increased over 2011–2013.
The NCES generally updates its degree data during the summer months. Watch for the next ASA report of the update in fall of 2021. One change to watch for is the effect of a new NCES degree categorization for data science. Numbers for statistics and biostatistics may fall because of programs currently using statistics to categorize their data science degrees.


 (No Ratings Yet)


