Statisticians Comment on Status of Climate Change Science
Richard L. Smith, University of North Carolina; L. Mark Berliner, The Ohio State University; and Peter Guttorp, University of Washington and Norwegian Computing Center
The authors discussed this article online, live, on March 31, 2010. The discussion can be viewed at the end of the article.
In November 2009, ASA Past-President Sally Morton joined with the leaders of 17 other science organizations to sign a letter (pdf) to all U.S. senators summarizing the consensus of climate change science. In short, the letter cited the strong scientific evidence that climate change is happening and that human activities are the primary driver. It went on to list the many likely consequences, some of which are already starting to occur.
As members of the ASA’s Climate Change Policy Advisory Committee, we commented on early drafts of the letter and, upon reviewing the final version, advised Morton to sign it. We are well aware that some disagree with the statements in the letter. The views of climate change ‘skeptics’ and ‘deniers’ appear in many media, from blogs and videos to op-eds and congressional testimony. We prefer to think of the views of skeptics as part of the scientific spectrum, but nevertheless believe they are a minority who do not represent the mainstream scientific viewpoint.
Some organizations that feature these views in sophisticated advertising campaigns have manipulated the evidence to create the impression that the consensus among climate scientists is quite different from what it is. Here, we comment on some of the most common arguments that climate change is not happening or that humans are not responsible.
Influence of Solar Activity
The idea that solar variability, rather than greenhouse gases, could explain a large part of the observed variability in climate gained considerable publicity due to the 1991 Science paper by Eigil Friis-Christensen and Knud Lassen (see “The Paper That Convinced Me of the Connection Between CO2 and Climate Change”). This point is still heavily debated. Nicola Scafetta and Bruce West, for example, argue in two recent Physics Today pieces that traditional reconstructions of the solar signal underestimate the influence of solar effects on climate. Their arguments were rebutted in the same publication by Philip Duffy, Benjamin Santer, and Tom Wigley. At the core of the dispute are two reconstructions of the solar intensity signal—each formed by combining data from several satellites—one containing a trend, the other not.
We do not have the expertise to say which reconstruction is to be preferred, but we believe it is important to set such disputes in the broader context of climate research. The relevance of this issue is in detection and
attribution studies in which the climate signal is apportioned over different external forcings, including both greenhouse gases (GHGs) and solar fluctuations. Different constructions of the solar signal could lead to different attributions of GHGs, which, in turn, could affect projections of future climate change in which GHGs are considerably increased.
Nevertheless, there is no credible physical theory that would deny the GHG influence. If the claims made about the solar influence are correct, that could somewhat modify projections of future temperature increases, but there is already plenty of uncertainty about those projections. Therefore, we do not feel controversies about the solar signal should play a major role in the assessment of climate science overall. It is a legitimate area of research to try to quantify the solar signal more accurately, including its uncertainty, and to assess the influence of such uncertainty on future projections.
Connection Between CO2 and Climate Change
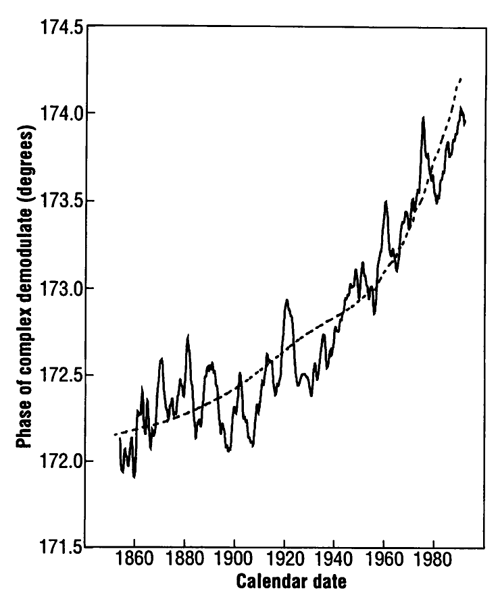
Peter Guttorp, University of Washington, Norwegian Computing CenterFifteen years ago, most scientists had not yet convinced themselves that greenhouse gases led to observable climate change. Indeed, the influence of solar activity was still a viable explanation for the observed increase in average global temperatures, thanks largely to a 1991 Science article by Eigil Friis-Christensen and Knud Lassen that showed temperatures were highly correlated with sunspot numbers.A 1995 Science article by David J. Thomson, titled “The Seasons, Global Temperature, and Precession,” provided the first strong evidence in favor of an observable greenhouse gas effect. Also notable is that the work was based primarily on a careful statistical analysis of the temperature series, rather than on climate models. To me, this paper was the first smoking gun that global warming is connected to the increase of CO2 concentrations in the atmosphere.There have been many works since to substantiate the connections, but an explanation of Thomson’s paper may be helpful to Amstat News readers.The amount of solar radiation reaching the Earth depends on the angle of Earth’s rotation to the ecliptic (the plane of the orbit) and its distance from the Sun (because the Earth’s orbit is elliptical). The former follows the “tropical” year, the time between two vernal equinoxes, which is 365.2442 days and governs seasons. The distance of the Earth from the sun follows the “anomalistic” year, the time between aphelion (farthest point from the sun) in Earth’s orbit, which is currently 365.2596 days.The interaction between these two cycles so close in time yields long temperature cycles, which result in the quarternary ice ages. The shortest of these cycles is about 26,000 years, very long compared to the instrumental record of temperature.Because these cycles are so close in value, one must use statistical tools to study their influences. Complex demodulation, in effect, removes one of the influencing cycles and looks at the remaining spectrum of a quantity, called the “phase.”
Phase of the Jones-Wigley Northern Hemisphere temperature series (solid) with average phase from 156 northerly land stations (dashed) and the line expected if the anomalistic year frequency dominates the tropical yearWhen one removes the influence of the tropical year, the phase should be flat if the dominant frequency is that of the tropical year. If the anomalistic year is dominant, we would expect to see a linear phase in the residuals with slope equal to the inverse of the difference between the frequencies (57.3 arc seconds per year). The figure above shows the phase of the Jones-Wigley Northern Hemisphere temperature series (solid line), the average phase for 156 stations above 23°N (dashed line) and the dotted line with a slope equal to the precession constant (the rate at which the Earth’s axis rotates).The analysis shows that between 1880 and 1920 the dominant frequency in the temperature series is the anomalistic one. To explain the phase diagram after 1920, a statistician would look at the “residuals,” the difference between the predicted (dotted) line and the estimated phase. The figure below shows the residuals, together with a fit to the logarithm of atmospheric CO2 levels.
Since the fit is excellent, we have two possible explanations: Either the CO2 levels are influencing the phase and thus changing the distribution of temperature (i.e., the climate) or there is a common underlying feature driving both the phase change and CO2 levels. No mechanism has been proposed that can do the latter.Graphics reprinted with permission from The American Association for the Advancement of Science

Climate Change Policy Advisory CommitteeIn addition to its work on their letter signed by Sally Morton, Climate Change Policy Advisory Committee members spent two days on Capitol Hill last year educating staff about the role statisticians play in climate change science and how statisticians view climate change. Committee members also responded to requests from congressional staff to review a climate change paper by an economist and, more recently, to produce a review of the health effects of climate change. This year, the committee plans to continue its outreach to Congress, educating them on the status of climate change science and the effects of climate change. Click here for more information about the Climate Change Policy Advisory Committee and its activities.
‘Hockey Stick’ Curve
A considerable amount of controversy has concerned the reconstruction of temperatures over the last millennium, in particular the famous “hockey stick” curve, first published by Michael Mann, Raymond Bradley, and Malcolm Hughes in a 1998 Nature article.
In 2006, Rep. Joe Barton (R-TX), then chair of the House Energy Committee, requested statistician Edward Wegman to re-examine the evidence behind the hockey stick curve. At the same time, the National Research Council (NRC) formed a committee, also containing several statisticians, to report more broadly on the scientific underpinnings of paleoclimatic research.
The report by Wegman (along with David Scott and Yasmin Said) supported 2005 criticisms made by Steven McIntyre and Ross McKitrick in Geophysical Research Letters of the statistical methods used in creating the hockey stick curve and the selection of proxies for the reconstruction. The NRC report was issued in 2006 and affirmed that these questions are relevant, but also pointed out that the evidence for a hockey stick shape was robust and had been reproduced in numerous other studies.
The NRC report also emphasized the inherent uncertainty of such reconstructions, especially concerning the existence of a “medieval warm period” and the estimation of temperature extremes in the early part of the millennium. Since 2006, a number of new studies have appeared proposing alternative statistical techniques for paleoclimatic reconstructions, including assessments of uncertainty and distributions of extremes. Presently, this is a lively area of statistical research on climate change.
In summary, while the Wegman report served to highlight relevant statistical issues, the research community has responded successfully to these challenges.
Temperature Leveling Off?
Another area of controversy has been the apparent leveling off of temperatures post-1998 and the suggestion that greenhouse gas warming has ended. However, this is largely a selection effect arising from the specific choice of 1998 as a starting year. Overall assessments of trend, including the past decade, still show a strong increase in global mean temperatures. Annual temperatures are affected by many sources of variability. For example, it is well known that 1998 was a peak El Niño year. Though the effect of El Niño on temperature varies strongly with season and location, the 1998 El Niño was an extremely warm event.
What are relevant are the long-term trends, not the influence of specific events. From this point of view, the slight decrease of observed temperature post-1998 is of no relevance to assessments of the long-term trend. We also note that reliance on global temperature hides much of the story and effects of climate change. For example, the 2009 average temperature over the southern hemisphere was higher than any observed since at least 1880.
A recent contribution to this topic is that of Susan Solomon and collaborators in Science, who in an article published online in January, showed that increases in stratospheric water vapor may have explained part of the post-1998 cooling.
‘Climategate’
Some have perceived the well-publicized leak of emails associated with researchers at the Climate Research Unit (CRU) of the University of East Anglia in November 2009—dubbed “Climategate”—as weakening the scientific case for climate change. In our view, none of the Climategate revelations change the fundamental science about climate change. To the extent they concern scientific challenges to the theory of anthropogenic global warming (AGW), they involve issues that have already been extensively debated in the scientific literature and elsewhere. Nevertheless, it seems desirable to review some of these issues and indicate our view of them:
- Following Climategate, the view has been widely repeated that climate scientists are secretive about their raw data and suppress data products that are inconsistent with AGW. This is not true. CRU is only one of several centers that have made extensive data archives available to the public; in the United States, the leading such center is the National Climate Data Center (NCDC), a division of NOAA. These data archives contain daily, monthly, and annual data from weather stations around the world, as well as gridded data (e.g., aggregates into 1° and 5° latitude and longitude boxes) that are intended to be directly comparable with the output of climate models. There are also extensive archives of proxy data, such as tree ring and borehole temperature records, that are used in paleoclimatic reconstructions of meteorology before the instrumental record began. Other organizations have created extensive archives of climate model runs, both past data (e.g., 20th century) runs that can be compared directly with the observational record and future model projections that have been at the center of Intergovernmental Panel on Climate Change reports. Click here for numerous sources of data and computer code.
- In one respect, the criticisms made in the Wegman, Scott, and Said report do seem to have been reinforced by the recent Climategate revelations. Wegman analyzed the social network of paleoclimatic researchers, suggesting that their conclusions were suspect because few outsiders had deeply scrutinized the results. The email exchanges have, indeed, shown considerable evidence of a social network in action. However, the more relevant point for the broader picture of climate research is that the conclusions of these researchers have, by now, been scrutinized by many others outside that small community and have largely held up to that scrutiny.
- We do think there are weaknesses in the ways climate data are currently processed. While it would not be reasonable, or even possible, to make every source of raw data available to the public, it is important that raw data sources used in creating public data sets—such as gridded data summaries—be fully documented, as well as the computer algorithms used to create public data sets. In many cases, these algorithms involve subtle statistical judgments (e.g., about outliers, adjustments for missing data, and temporal and/or spatial correlations) that should be open to scrutiny by others, including statisticians who may possibly have ideas for improving them.
Some of the leaked emails suggested that authors tried to keep data secret after publication of the results. Such data secrecy, we believe, is not appropriate in most cases. The Journal of the American Statistical Association (JASA) has a data policy that requires that “Whenever a data set is used, its source should be fully documented. When it is not practical to include the whole of a data set in the paper, the paper should state how the complete data set can be obtained.” Many other scientific journals have similar policies, but it not clear how rigorously any of the policies are enforced in practice. We believe the JASA policy, or something similar, should be the norm in scientific publishing.
The leaked emails of Climategate highlight relevant issues to the assessment of climate research, including data handling and documentation. On broader issues of response to skeptics in such areas as the hockey stick reconstruction, the influence of the solar signal, and the interpretation of the post-1998 leveling off of temperatures, we think climate skeptics have raised legitimate points in each case—several times involving statistical methods or the assessment of associated uncertainties—that should be the focus of further research. However, these points do not change our view that the climate is warming, that anthropogenic influences are likely responsible, and that appropriate mitigation measures need to be considered.
Richard L. Smith is a statistics professor at The University of North Carolina and the Mark L. Reed III Distinguished Professor. Mark Berliner is a statistics professor at The Ohio State University and has held positions at the National Center for Atmospheric Research and National Institute of Statistical Sciences. Peter Guttorp is a statistics professor at the University of Washington, researcher at the Norwegian Computing Center, and director of the Northwest Research Center for Statistics and the Environment.
The following is the transcript of the online question and answer discussion which took place March 31, 2010.
- 12:11 PM: Steve Pierson Welcome to the live Q&A with Richard L. Smith, L. Mark Berliner, and Peter Guttorp, the authors of the March Amstat News article, “Statisticians Comment on Status of Climate Change Science”. Starting at noon EDT, they will answer your questions. ASA Director of Science Policy Steve Pierson will be moderating. Click on the black bar to enter your question. (Note: For carriage returns, hit shift-enter.)The authors will give preference to questions over comments.
- 1:04 PM: Frederick K. Childers [Question 1:] Are you entertaining questions and comments concerning the letter that you recommended Sally Morton sign? If yes, what is the basis for stating climate changes include … greater threats of extreme weather events, increased regional water scarcity, … and western wildfires? The climate change community claims that their computer simulations do not predict regional climate/weather well.
- 1:05 PM: Frederick K. Childers With reference to Susan Solomon’s recent paper: The paper showed a decrease in stratospheric water vapor not an increase. SWith regince water vapor is the most important greenhouse gas (by a significant margin), less water vapor in the stratosphere should result in cooling. The modelers will have to tell us if their calculations agree with the measurements.
- 1:05 PM: Frederick K. Childers I found the discussion of “The Paper That Convinced Me of the Connection Between CO2 and Climate Change” confusing. Whereas the intensity of solar radiation incident on the surface of the earth depends on the angle of Earth’s rotation to the ecliptic, we are concerned with average global temperature which not related to this angle. I found the comment distracting and confusing.
- 1:07 PM: Peter Guttorp @Frederick K. Childers [Question 1 reply:] The issue of regional climate effects has been studied by the US Climate change Science Program. The basis for the statement was one of their synthesis reports
- 1:12 PM: Mark Berliner @Frederick K. Childers : [More on Question 1:]The argument is simple and reasonable over a wide range of quantifications: warming>more precip as rain in fall and spring>faster, sooner snow melt>decreased snow pack>decreased soil moisture>drought>fire
- 1:13 PM: Richard Smith @Frederick K. Childers Comment on Susan Solomon’s paper – yes, thank you for the correction, the paper did refer to a decrease in water vapor after 2000, not an increase.
- 1:14 PM: Guy [Question 2:] You mentioned that the NRC report “pointed out that the evidence for a hockey stick shape was robust and had been reproduced in numerous other studies”, but neglected to mention the Wegman report’s criticisms of those other studies for not being independent. Could you comment on this now?
- 1:19 PM: Richard Smith @Guy [Question 2 reply:] The other studies that we were referring to are studies that have re-analyzed the data essentially taking account of Wegman’s criticisms of the principal components analysis – so the datasets are not independent, but the analyses are new. In particular, Bo Li, Doug Nychka and Caspar Ammann have written two papers using Bayesian hierarchical models – one in Tellus (2007), the other accepted for JASA but currently available (I believe) as a preprint. Other papers in process include one by Tingley and Huybers, and one to appear by Mark Berliner and a student.Richard Smith
- 1:19 PM: petercraigmile [Question 3:] In your article you mention gridded data are “intended to be directly comparable with the output of climate models”. Can you comment further on how you each believe gridded data products are useful in climate analyses.
- 1:21 PM: Peter Guttorp @petercraigmile [Question 3 reply:] The obvious direct issue is to compare the distribution of gridded weather data to the distribution of climate model output (climate, in this context, being the long-term distribution of weather).
- 1:22 PM: Peter Guttorp @petercraigmile [Question 3 reply continued:] The issues are change of support, in addition to weather not being directly comparable to climate model output.
- 1:32 PM: Mark Berliner

- 1:37 PM: PaulM [Question 4:] Climate scientists seem to have invented a new statistic, the “RE” statistic, to replace the “R2” statistic which is used by all other scientists and statisticians. What do you statisticians think of the “RE” statistic? Have you heard of it? 🙂
- 1:38 PM: petercraigmile @Mark Berliner [Question 5 regarding image posted by Mark Berliner:] It is interesting to see how different the tree rings reconstruction differs from the other proxies. Also, why is the borehole reconstruction so smooth?
- 1:39 PM: Fredrick K childers Thank you for the opportunity to “talk” to the authors.
- 1:48 PM: Richard Smith @petercraigmile [Question 5 reply:] This issue is discussed in the forthcoming Li, Nychka, Ammann paper. The basic issue is that it is necessary to smooth over a longer time period to reconstruct temperature from the borehole, especially going further back in time, Therefore, I suspect the smooth shape of the reconstruction is a consequence of the type of data rather thsan a real climatological effect. Bo Li has a list of preprints on her webpage www.stat.purdue.edu though when I tried just now I did not succeed in downloading that paper.
- 1:48 PM: Peter Guttorp @PaulM [Question 4 reply:] Not really. From the description in the paper it seems to be related to the percent variance explained, but the formula given does not make sense to me. I think my pdf file is damaged somehow.
- 1:48 PM: J. Arthur [Question 6:] You say that you are of the view that the climate is warming. What are the main lines of evidence, or statistical analyses, to support that view?
- 1:51 PM: Richard Smith @J. Arthur [Question 6 reply:] The IPCC report (www.ipcc.ch, 2007, working group 1) has a fairly strong statement to this effect in its summary for policymakers (they say evidence for warming is “unequivocal”, whereas the evidence that it is human caused is merely “very likely”). Besides, several of us statisticians have analyzed temperature data from numerous different points of view, and I don’t think any of us doubt that there is an overall warming effect.
- 1:54 PM: J. Arthur @Question 6 Reply [Richard Smith], you say “several of us statisticians have analyzed temperature data from numerous different points of view”; will you give examples of published statistical analyses of temperature data (that support global warming)?
- 1:57 PM: Peter Guttorp @J. Arthur [Question 6 thread:] Here is one
Trend assessment in a long memory dependence model using the discrete wavelet transform
Environmetrics
Volume 15, Issue 4, Date: June 2004, Pages: 313-335
Peter F. Craigmile, Peter Guttorp, Donald B. Percival - 1:58 PM: Richard Smith @J. Arthur [Question 6 thread:] One of my own is: R.L. Smith (1993), Long-range dependence and global warming. In Statistics for the Environment, edited by V. Barnett and F. Turkman, John Wiley, Chichester, 141-161. There were a couple of other papers around 1991-1992 by Peter Bloomfield (and one by Bloomfield and Doug Nychka) in the journal Climate Dynamics
- 1:58 PM: Guy [Question 7:] On the IPCC reports: Do you consider the statistical content of the last IPCC report to be adequate? Do you think more statisticians should be involved with the IPCC and other climate science research?
- 1:59 PM: Peter Guttorp [Question 6 thread:] Trend assessment in a long memory dependence model using the discrete wavelet transform
Environmetrics
Volume 15, Issue 4, Date: June 2004, Pages: 313-335
Peter F. Craigmile, Peter Guttorp, Donald B. Percival - 1:59 PM: J. Arthur @Richard Smith, Thank You!!
- 2:00 PM: Steve Pierson Thank you all for watching and commenting. Thanks also to the authors for their time. Feel free to follow up through Steve Pierson: pierson@amstat.org. We will wrap up shortly.
- 2:00 PM: Guy [Question 8:]On humans causing the warming trend: Do you think the IPCC assessment of this as “very likely” has a good statistical basis? How did they come to this conclusion?
- 2:01 PM: Peter Guttorp [Question 7 reply:] I have spent the last decade or two promoting interest in statistical climatology, and trying to get statisticians involved in IPCC. The history is interesting, but I don’t have time to do it here. However, there is now for the first time a statistician as vice chair of IPCC WG 1 (Francis Zwiers from Canada), More are definitely needed.
- 2:07 PM: Richard Smith @Guy [Question 8 reply:] There is a by now very large field known as “detection and attribution” analysis. See chapter 9 of working group 1 of the 2007 IPCC report (available online through www.ipcc.ch). The essential idea is to decompose the climate signal into (typically) four components, due to greenhouse gases, sulfate aerosols, solar radiation and volcanic effects. There is quite a sophisticated statistical methodology, mostly developed by climate scientists (see e.g. Allen and Stott, Climatic Change 2003) that performs a multiple regression in a high-dimensional space of observations. If the regression coefficient for greenhouse gases is statistically significant, then the effect is said to be “detected”. The practical interpretation of this is that the observed warming cannot be explained by natural forcings alone. When the IPCC says “very likely”, they mean the probability of the effect is more than 90%. They usually interpret this to be the same thing as rejecting a null hypothesis at the 0.1 level of significance. As a statistician, I am not so comfortable with this definition of “very likely”, but it is one very widely used in IPCC and other summary reports.
- 2:09 PM: Steve Pierson Thanks everyone! Now closing!
References
1. Duffy, P.B., Santer, B.D. and Wigley, T.M.L. (2009), Solar variability does not explain late 20th-century warming. Physics Today, January 2009, 48-49.
2. Friis-Christensen, E. and Lassen, K. (1991), Length of the solar cycle: An indicator of solar activity closely associated with climate. Science 254, 698-700.
3. Hegerl, G.C. et al (2007), Understanding and Attributing Climate Change. In: Climate Change 2007: The Physical Science Basis. Contribution of Working Group I to the Fourth Assessment Report of the Intergovernmental Panel on Climate Change (S. Solomon et al, eds), Cambridge University Press, pp. 663-745.
4. Mann, M.E., Bradley, R.S. and Hughes, M.K. (1998), Global-scale temperature patterns and climate forcing over the past six centuries. Nature 392, 779-787.
5. Mann, M.E., Bradley, R.S. and Hughes, M.K. (1999), Northern Hemisphere temperatures during the past millennium: Inferences, uncertainties, and limitations. Geophys. Res. Lett. 26, 759-762.
6. McIntyre, S. and McKitrick, R. (2005), Hockey sticks, principal components, and spurious significance. Geophys. Res. Lett. 32, L03710, doi:10.1029/2004GL021750.
7. National Research Council (2006). Surface Temperature Reconstructions for the Past 2,000 Years. The National Academies Press, Washington, D.C. 2006.
8. Scafetta, N. and West, B.J. (2008), Is climate sensitive to solar variability? Physics Today, March 2008, 50-51.
9. Scafetta, N. and West, B.J. (2009), Interpretations of climate-change data. Physics Today, November 2009, 8-10.
10. Solomon, S. et al. (2010), Contributions of Stratospheric Water Vapor to Decadal Changes in the Rate of Global Warming. Science Express, Published online 28 January 2010 [DOI: 10.1126/science.1182488]
11. Wegman, E.J., Scott, D.W. and Said, Y.H. (2006), Ad hoc committee report on the “Hockey Stick” global climate reconstructions. Committee on Energy and Commerce and Subcommittee on Oversight and Investment, U.S. House of Representatives, Washington, D.C.


 (No Ratings Yet)
I was excited to share this article with my students, colleagues and skeptics, but a minor typo like the fact that perihelion represents the point in the earth’s orbit furthest from the sun can really shed some doubt on the credibility of such an article.
Yes they should fix the reference to perihelion, as it is the closest point to the sun. Not that it matters, it is only a reference point for determining the orbit time.
Thank you for all of your comments. The reference to perihelion has been changed to aphelion. If you have additional questions or comments, visit this page again on March 31 at noon (EST) for a live online conversation.
I think that this article could be relevant for this discussion:
Global and hemispheric temperatures revisited
Abstract To characterize observed global and hemispheric temperatures, previous studies have proposed two types of data-generating processes, namely, random walk and trend-stationary, offering contrasting views regarding how the climate system works. Here we present an analysis of the time series properties of global and hemispheric temperatures using modern econometric techniques. Results show that: The temperature series can be better described as trend-stationary processes with a one-time permanent shock which cannot be interpreted as part of the natural variability; climate change has affected the mean of the processes but not their variability; it has manifested in two stages in global and Northern Hemisphere temperatures during the last century, while a second stage is yet possible in the Southern Hemisphere; in terms of Article 2 of the Framework Convention on Climate Change it can be argued that significant (dangerous) anthropogenic interference with the climate system has already occurred.
http://www.springerlink.com/content/h0tx44h508602755/?p=9507c7c71bd044bf9d0c6beb8aa9c0fc&pi=7
What is not discussed in this article is whether the normalized temperature data assembled by CRU (and which apparently was used to normalized the other temperature databases) is itself trustworthy.
It is my understanding that the normalization from the raw temperature data was not sufficiently peer-reviewed. Furthermore, since CRU’s raw database is no longer available (per my understanding), it is impossible to determine what normalization was even done.
One published comparison of raw vs. normalized temperature for (I believe) the Dalton station showed a very anomalous correction which, in my view, was not justified as it grossly overstated the temperature rise and even created a sort of “hockey stick” effect. This one data point calls into question the entire process of normalization.
Since the computer climate models and satellite data are themselves calibrated to the normalized temperature data, the entire conclusion of AGW theory should be called into question until the normalized database is regenerated under full public peer review. This would require, of course, re-acquiring all the world’s raw temperature data for the last century if it doesn’t already exist in one place.
Before we make multi-trillion dollar political decisions that will adversely affect the western world, it is important to have proof which is based upon trustworthy, and full peer-reviewed normalized data.
There is a relevant discussion of statistics starting here (http://ourchangingclimate.wordpress.com/2010/03/01/global-average-temperature-increase-giss-hadcru-and-ncdc-compared/#comment-1216) by a person called VS that I think it would be extremely valuable for the ASA to comment on. Is VS correct? Is the Beenstock and Reingewertz paper being discussed correct? If not, what are the errors?
This is a pure statistics question, rather than involving physics/climatology, so I believe the AMS will have the relevant expertise to comment.
Thanks very much.
Regarding Fred’s link to a post by “VS”:
A detailed debunking of the statistical claims made by “VS” can be found here:
“Not a Random Walk”
http://tamino.wordpress.com/2010/03/11/not-a-random-walk/
and updated here:
http://tamino.wordpress.com/2010/03/16/still-not/
Hi everybody,
Hmm, I missed this activity/thread.
A question to the ASA, just for the record:
“What’s the ASA’s take on the non-stationarity of the instrumental temperature record?”
You all know what that means, and you all know what it implies.
———-
Those mentioning Tamino might want to take a look at my reply to Tamino’s claims. As a matter of fact, I’m inviting the ASA to look at them as well.
http://ourchangingclimate.wordpress.com/2010/03/01/global-average-temperature-increase-giss-hadcru-and-ncdc-compared/#comment-1643
Hamilton, you might want to take a look at this book:
http://www.amazon.com/Time-Analysis-James-Douglas-Hamilton/dp/0691042896
All the best, VS
Also, I would like to take this opportunity to invite *each and every* statistician/econometrician reading this to take a look at this post, and join the discussion with her or his expert opinion (be that critical or supportive). All intelligent review welcomed!
http://ourchangingclimate.wordpress.com/2010/03/01/global-average-temperature-increase-giss-hadcru-and-ncdc-compared/#comment-2740
The debate in this thread has been going on for over month now. There are plenty of test results, monte carlo simulation results (with code) and specification diagnostics posted under that link. I know for a fact that a lot of people are following the discussion.
Furthermore, I believe that the questions adressed are *important*, and the implications for statistical analysis performed in climate-science *severe*.
Looking forward to everybody’s contributions!
Kind regards, VS
PS. Here’s how Josh the cartoonist ‘translated’ the contents of the discussion on Bart’s blog, in case you are in need of an ‘executive summary’ 😉
http://www.cartoonsbyjosh.com/unit-root-presence_scr.jpg
Francisco said:
” The temperature series can be better described as trend-stationary processes with a one-time permanent shock which cannot be interpreted as part of the natural variability; climate change has affected the mean of the processes but not their variability; it has manifested in two stages in global and Northern Hemisphere temperatures during the last century, while a second stage is yet possible in the Southern Hemisphere; ”
Actually, I tested the GISS global-mean series for a unit root, with an endogenously determined structural break (turned out to be 1964) in the Ha. This was performed via the so-called Zivot-Adnrews unit root test.
The presence of a unit root is not rejected. Test results posted under the link given above.
Again, I implore all statisticians/econometricians to join the discussion and share their thoughts.
Regards, VS
Dear VS, please be aware that “the Zivot-Andrews tests often diverge or are not invariant to break parameters (Vogelsang and Perron 1998; Kim and Perron 2007)”. For these reasons, the results of this test were omitted in the paper i’m citing.
“These problems are not present in the Perron (1997) test when the break date is selected by minimizing the sum of the squared residuals. Furthermore, Kim and Perron (2007) provide a testing procedure that allows a break in the trend function under both the null and the alternative hypotheses and that has the same limit distribution as if the break date was known. These tests have greater power, maintain
the correct size and simulation experiments have shown that they offer an improvement over other commonly used methods in small samples.”
Even Eric Zivot has stated that his test should not be used.
Best regards
Francisco
Hi Francisco,
Thank you for your valuable comment!
I know (through MC and Stock (1994)) that the PP test has severe size distortions conditional on a ARIMA(3,1,0) w/o drift or ARIMA(0,1,2) w drift that, respectively, me and Breuch and Vahid found.
ADF with SIC/HQ selection is exact (but obviously doesn’t account for potential breaks, I hence also used ZA).
I’ll try to run the MC’s on Kim and Perron (2007) as well.
Again, thanks for the pointer 🙂
Best, VS
I suggest that instead of indulging VS in his pseudo-skeptical campaign, you indulge a more credible site run by a statistician:
http://tamino.wordpress.com/
Hi Steven,
If Grant Foster (a.k.a. Tamino) was actually a trained statistician, instead of a ‘home schooled’ civil engineer, you might actually have a point.
However, as the link in my first post here demonstrates, Foster doesn’t know how to test for stationarity (or a structural break, for that matter). One can infer a lack of formal training in statistics from this very piece of information.
In fact, I have yet to find any evidence of his statistics qualifications online (and no, ‘self-proclamation’ is not evidence).
Best if people stick to what they know, don’t you think? 🙂
Kind regards, VS
PS. I did enjoy listening to his Bedlam Boys song while explaining to him why you can’t ‘prove’ that unit root testing ‘doesn’t work’ by performing a spurious regression on 34 observations (i.e. his second ‘debunkation’, entitled ‘Still Not’ :).
Here’s the song in question: http://www.youtube.com/watch?v=mQIAT4Hh7Jc
And where are VS’s statistics qualifications online (and no, “self proclamation” is not evidence)?
VS, you don’t seem to have looked very hard. Try a search at google scholar (hint, +grant +foster). His top cited paper has 118 cites, pretty good for someone who is not a statistician.
> The views of climate change ’skeptics’ and ‘deniers’ appear in many media,
> from blogs and videos to op-eds and congressional testimony. We prefer to
> think of the views of skeptics as part of the scientific spectrum, but
> nevertheless believe they are a minority who do not represent the
> mainstream scientific viewpoint.
Now that you’ve taken this public stance, I hope someone at the ASA is going to watch the comments and not ignore the people claiming to be statisticians who are making claims as statisticians about climate change.
You’ve taken notice of an open can of worms — which is good.
Now, please keep paying attention to the people claiming statistical expertise about climate change who only appear in blogs and videos.
They’re reaching the public with assertions they claim are good statistics.
Your move.
>>Since the fit is excellent, we have two possible explanations: Either the CO2 levels are influencing the phase and thus changing the distribution of temperature (i.e., the climate) or there is a common underlying feature driving both the phase change and CO2 levels. No mechanism has been proposed that can do the latter<<
Human beings have industrialized as the earth has come out of the little ice age. As such, it is the warming that is driving human activity, which is driving the release of CO2.
However, the human released CO2 is such a small portion of total released CO2 each year, it could be that the effect is natural. The sun and clouds have been proposed as just such a mechanism. Increased solar radiation reaching the surface heats the oceans, endig the little ice age, releasing more CO2.
ge0050 says: the human released CO2 is such a small portion of total released CO2 each year, it could be that the effect is natural.
This claim is false.
How do human CO2 emissions compare to natural CO2 emissions?
See also: Last time carbon dioxide levels were this high: 15 million years ago
ge5000, yours is a common misconception.
More details at the link, suffice it to say that there are many lines of investigation including isotope studies that show that humans are responsible for the ~30% increase in atmospheric CO2.
These clowns can’s accurately predict the weather a week ahead of time and yet they confidently predict what will happen 100 years from now in a highly non-linear system based on very imperfect computer models that disagree with one another. This is science?
I’ve been reading with interest the comments of VS on various message boards. Aren’t you curious about the identity of VS? There aren’t that many people in the world with that particular profile of specialist knowledge. Some of you are assuming VS is male. After 10 minutes of detective work, I concluded that VS is a female econometrician working at a very prestigious institution. Keep on posting VS. Global warming needs more scrutiny by bona fide experts in random processes.
Your overview of the “hockey stick” appears to imply that the Wegman Report preceded the NRC report. In fact, the NRC reported in March 2006 and the Wegman Report in July 2006.
The Wegman Report raised no new legitimate criticsms and highlighted no new statistical issues, beyond those already in the previously published NRC Report. In fact, even though their mandate was narrower than the NRC’s, Wegman et al failed to address all of the relevant literature concerning the M&M critique. In particular, Wegman et al did not even mention the two critical comments (Huybers and von Storch) on M&M’s GRL article. And they dismissed, without any substantive discussion, Wahl and Ammann’s thorough examination of M&M, which remains to this day the lone peer-reviewed article on the matter.
Wegman et al purported to identify supposed problems of peer review in the field of paleoclimatology, and in general purveyed much misinformation about the field. As well, serious questions have been raised about the scholarship and the process behind the Wegman Report. It stands as a textbook case of the wrong way to involve statisticians in climate science in every respect.
Re-reading the comments (which include some from some DeepClimate regulars), I have a feeling that few have read page 2.
I read the sidebar article, “The Paper that Convinced Me of the Connection Between Carbon Dioxide and Climate Change”, by Peter Guttorp, in the March 2010 issue of Amstat News, with interest. I have been interested in the greenhouse effect since the early 70’s, at which time I was working on a bachelors degree in physics at Reed College, doing research on solar energy. I decided to write comments on Guttorp’s article and ended up writing 11 pages on the mechanics of climate change. I concluded that there is probably too much noise in the precessions of the equinox and perihelion/aphelion to pick out the signal of the greenhouse effect from the precessions in the short time of 120 years. However, I am not familiar with the technique that Guttorp used. My comments can be found at http://www.globalccs.net/~vanstat/climate.htm. The book Storms of my Grandchildren, by James Hansen, who is a climate researcher and much more knowledgeable and experienced than myself in the area of climate research, is a good overview of the causes of climate change. As a disclaimer, Dr. Hansen’s sister is married to my second cousin, who sent my husband and myself the book.
Welcome!
Amstat News is the monthly membership magazine of the American Statistical Association, bringing you news and notices of the ASA, its chapters, its sections, and its members. Other departments in the magazine include announcements and news of upcoming meetings, continuing education courses, and statistics awards.
ASA HOME
Departments
Archives
ADVERTISERS
PROFESSIONAL OPPORTUNITIES
FDA
US Census Bureau
Software
STATA
QUOTABLE
“ My ASA friendships and partnerships are some of my most treasured, especially because the ASA has enabled me to work across many institutional boundaries and
with colleagues from many types of organizations.”
— Mark Daniel Ward
Editorial Staff
Managing Editor
Megan Murphy
Graphic Designers / Production Coordinators
Olivia Brown
Meg Ruyle
Communications Strategist
Val Nirala
Advertising Manager
Christina Bonner
Contributing Staff Members
Kim Gilliam
Contact us
Amstat News
American Statistical Association
732 North Washington Street
Alexandria, VA 22314-1904
(703) 684-1221
www.amstat.org
Address Changes
Amstat News Advertising