• Skip to main content
  • Skip to secondary menu
  • Skip to primary sidebar
  • Skip to footer
  • Homepage
  • About Us
  • Advertising
  • Submission Instructions
  • Editorial Calendar
Amstat News

Amstat News

The Membership Magazine of the American Statistical Association

  • Printed Issues
  • Practical Significance Podcast
  • Additional Features
  • Columns
  • Member News
  • Departments
You are here: Home / Featured Stories / Undergrad Statistics Degrees Continue Large Increases in 2012

Undergrad Statistics Degrees Continue Large Increases in 2012

October 1, 2013 1 Comment

Figure 1. Statistics degrees at the bachelor’s, master’s, and doctorate levels in the United States. These data include the following categories: statistics, general; mathematical statistics and probability; mathematics and statistics; statistics, other; and biostatistics. Data source: NCES Digest of Education Statistics (DES), http://nces.ed.gov/programs/digest

Women account for large portion of degrees

This column is written to inform ASA members about what the ASA is doing to promote the inclusion of statistics in policymaking and the funding of statistics research. To suggest science policy topics for the ASA to address, contact ASA Director of Science Policy Steve Pierson at pierson@amstat.org.

Contributing Editor
Pierson-color copySteve Pierson earned his PhD in physics from the University of Minnesota. He spent eight years in the physics department of Worcester Polytechnic Institute and later became head of government relations at the American Physical Society before joining the ASA as director of science policy.

The 2012 statistics degree data recently released by the National Center for Education Statistics (NCES) show that interest in undergraduate statistics degrees continues to grow rapidly. Bachelor’s degrees in statistics were up 26% over the year before. Master’s degrees continued strong growth at 6%, and PhD’s were up 10%.

The 2011 to 2012 jump continues the strong growth reported in the May Amstat News column “Growing Numbers of Stats Degrees.” (That column also compared the growth in statistics degrees to mathematics and physics and showed the degree growth also extended to enrollment in undergraduate degrees and AP Statistics.) Bachelor’s degrees more than doubled in five years, while master’s and doctorate degrees doubled over nine-year periods. The 10% jump in PhDs from 2011 to 2012 is because of a 38% jump in biostatistics PhDs, from 125 to 173. See Figure 2.
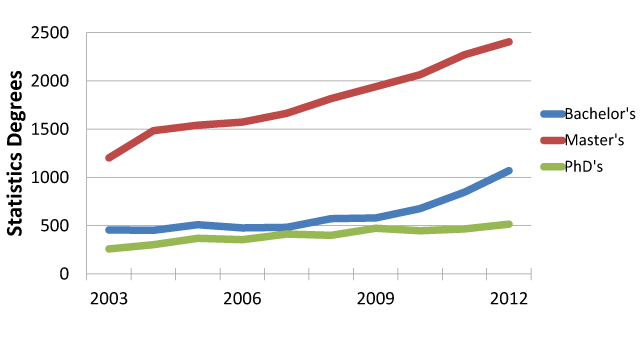
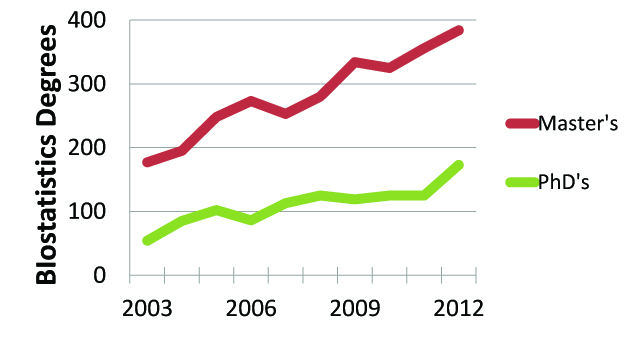
Figure 1. Statistics degrees at the bachelor’s, master’s, and doctorate levels in the United States. These data include the following categories: statistics, general; mathematical statistics and probability; mathematics and statistics; statistics, other; and biostatistics. Data source: NCES Digest of Education Statistics (DES), http://nces.ed.gov/programs/digest
Figure 2. Biostatistics degrees at the master’s and doctorate levels in the United States. Bachelor’s degrees in biostatistics averaged 16 from 2003–2012. Data source: NCES DES

The 2012 bachelor’s degree total is even higher—1,374 instead of 1,071—if one includes statistics degrees categorized as second degrees. However, for purposes of simple comparison with growth of other degrees, I only use the first award data. The exception is the last two tables in this column, in which I used both first and second degree data.

A further examination of NCES data for statistics and biostatistics shows that, relative to other science fields, a large percentage of statistics degrees are conferred to women. While the majority of biology undergraduate and graduate degrees go to women, more than 40% of statistics degrees go to women. This is much higher than computer science, engineering, and physics. For undergraduate and master’s degrees, roughly the same proportion of mathematics and statistics degrees is conferred to women. For PhDs, the percentage of mathematics degrees going to women drops to roughly 25%.
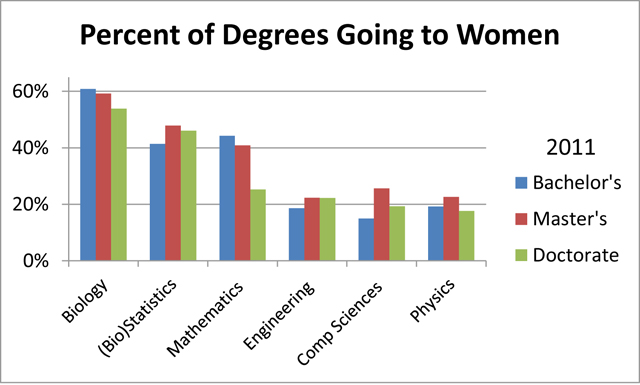
Figure 3. Percentage of 2011 degrees going to women for six disciplines, where the only the categories “Statistics, General” and biostatistics were used for “(Bio)Statistics.” It should be noted that (Bio)Statistics has the smallest number of degrees in each category for the six disciplines displayed. Source: NCES DES
Figure 4. Percentage of “Statistics, General” and “Biostatistics” degrees conferred to women for 2003, 2008, and 2012. Data Source: NCES DES

Figure 4 shows the three levels of statistics degrees for 2003, 2008, and 2012. The proportion of undergraduate degrees going to women seems fairly steady, with perhaps a small recent drop. Master’s degrees are closer to 50% going to women. The PhD data show more variability, perhaps because of the smaller numbers.

If one compares the proportion of degrees going to women between “Statistics, General” and “Biostatistics,” one finds that more biostatistics graduate degrees are going to women. For 2011 and 2012 combined, 57% of master’s degrees in biostatistics went to women (740 total biostatistics degrees over the two years) and 55% of PhDs went to women (298 total degrees). For “Statistics, General,” 47% of master’s degrees went to women (3,600 total degrees over two years) and 39% percent of PhDs went to women (out of 656).
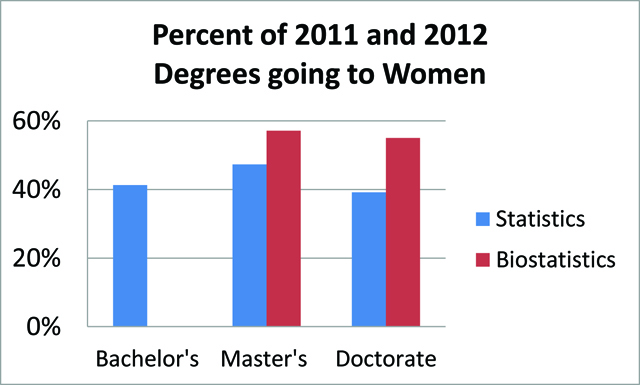
Figure 5. 2011 and 2012 degree data were combined. Undergraduate biostatistics degrees are not shown because of low overall number: 44 combined for 2011 and 2012. “Statistics” only includes the category “Statistics, General.” Data source: NCES DES

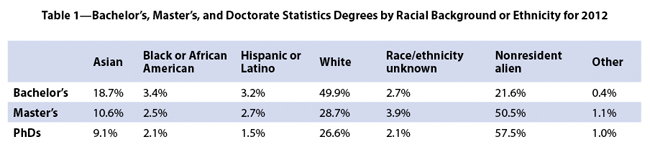
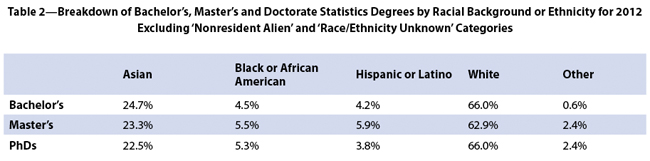
Finally, turning to racial background and ethnicity, Table 1 shows the breakdown by degree level where one sees an increasing percentage of nonresidents earning the degrees as the degree level increases. The percentage of Black/African Americans and Hispanic/Latinos students earning degrees is small in all categories. Excluding the “nonresident alien” and “race/ethnicity unknown” categories, one sees in Table 2 that Asians account for about a quarter of degrees at each level, whites about two-thirds, and the others, collectively, about 10%.
Source: NCES IPEDS
Source: NCES IPEDS
Source: NCES IPEDS
Source: NCES IPEDS

The “other” category includes American Indian or Alaska Native, Native Hawaiian or Other Pacific Islander, and two or more races. The degree data in tables 1 and 2 are for the five categories used in Figure 1: statistics, general; mathematical statistics and probability; mathematics and statistics; statistics, other; and biostatistics.

For a discussion of mathematical sciences degrees by gender, citizenship/residency, and race/ethnicity, see Chapter 5 of the National Academies’ 2013 report The Mathematical Sciences in 2025.

Filed Under: Featured Stories, Science Policy Tagged With: degrees, statistics, undergrad, women

Reader Interactions

Comments

  1. Steve Pierson says

    September 29, 2014 at 1:33 pm

    See the 2013 data at Bachelor’s Degrees in Statistics Surge Another 20%
    http://magazine.amstat.org/blog/2014/09/01/degrees/

    Reply

Leave a Reply Cancel reply

Your email address will not be published. Required fields are marked *

Primary Sidebar

Search

More to See

Jennifer L. Green: The Collaborative Life of a Statistics Professor and Teacher Mentor

September 1, 2026 By Megan Murphy

Meetings, Manuscripts, and Meows: Spend a Day with Charlotte Walsh

September 1, 2026 By Megan Murphy

Students’ Statistical Thinking When Using Generative AI

September 1, 2026 By Megan Murphy

What Students Taught Me About Teaching Statistics

September 1, 2026 By Megan Murphy

STATAcorp. Efficiency matters. Stata is easy to use, so you spend less time learning software and more time focusing on your research
Data Science Certification

ASA HOME

American Statistical Association

Communications from the Executive Director

ASA Leader Hub

ASA Career Connect

ADVERTISERS

STATA
SIAM

Archives

Categories

Footer

Editorial Staff

Managing Editor
Megan Murphy

Graphic Designers / Production Coordinators
Olivia Brown
Meg Ruyle

Communications Strategist
Val Nirala

Advertising Manager
Christina Bonner

Contributing Staff Members
Kim Gilliam

American Statistical Association
277 South Washington Street, Suite 370
Alexandria, VA 22314-3646
Phone: (703) 302-1857


Copyright © 2026 · Magazine Pro on Genesis Framework · WordPress · Log in