2017–2018 Academic Salary Survey
Patricia Hall, Medical College of Georgia; Varghese George, Augusta University; and Donna LaLonde and Ron Wasserstein, ASA
The 2017–2018 academic salary survey includes both faculty and nonfaculty statisticians and biostatisticians. We received responses from 68 institutions in the United States. The data included 1,289 faculty and 148 nonfaculty statisticians with gender information. The quartiles and 90th percentile for relevant categories are provided in the summary tables.
Faculty Data
The faculty data set—comprised of 840 males, 448 females, and 1 who identified as transgender—included faculty members in 32 statistics departments (N = 629), 26 biostatistics departments (N = 537), and 17 mathematical sciences departments (N = 123).
Table 1 summarizes salary information for full-time academic faculty in statistics departments by rank and years in rank, based on nine-month salary.
Table 2 provides similar information for full-time academic faculty in biostatistics departments, but is based on 12-month salary. Table 3 summarizes salary information on full-time academic faculty in the mathematical sciences departments by rank, based on nine-month salary. A few cases of statistics and mathematical sciences faculty with 12-month salaries were adjusted down by a factor of one-fourth, and a few cases of biostatistics faculty with nine-month salaries were adjusted up by a factor of one-third. Tables 4, 5, and 6 provide similar percentiles for the groups in Tables 1, 2, and 3, respectively, stratified by gender. Tables 8, 9, and 10 provide salary information by tenure status.
Nonfaculty Data
The nonfaculty data set included 148 observations from 22 institutions, with 24 observations at the doctoral level and 124 at the master’s level. Of the 148 individuals, there were 133 from biostatistics departments, 14 from statistics departments, and 1 from mathematical sciences. Table 7 provides their salary distribution, stratified by highest degree (master’s or doctorate) and years since obtaining the highest degree.
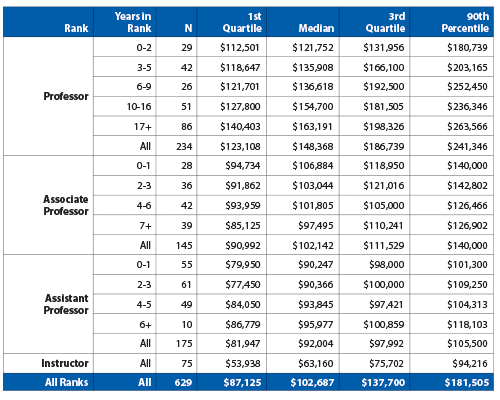
Table 1—2017–2018 Academic Faculty in Statistics Departments by Rank and Years in Rank, Based on 9-Month Salary
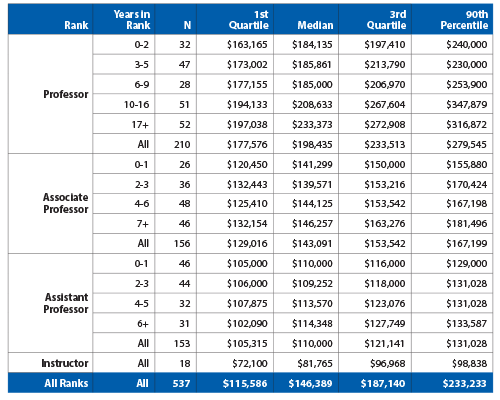
Table 2—2017–2018 Academic Faculty in Biostatistics Departments by Rank and Years in Rank, Based on 12-Month Salary
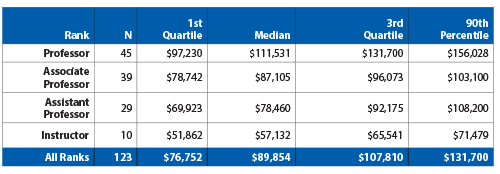
Table 3—2017–2018 Academic Faculty in Mathematical Sciences Departments by Rank, Based on 9-Month Salary
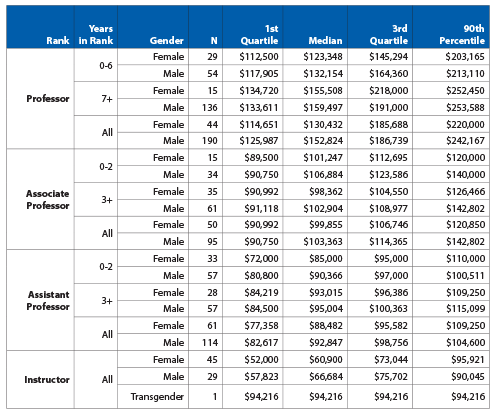
Table 4—2017–2018 Academic Faculty in Statistics Departments by Rank, Years in Rank, and Gender, Based on 9-Month Salary
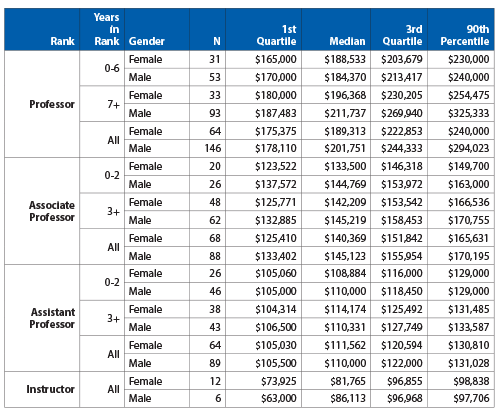
Table 5—2017–2018 Academic Faculty in Biostatistics Departments by Rank, Years in Rank, and Gender, Based on 12-Month Salary
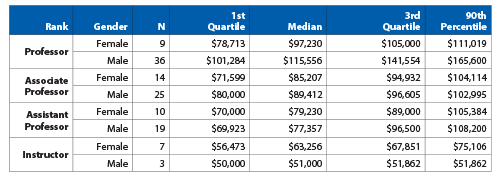
Table 6—2017–2018 Academic Faculty in Mathematical Sciences Departments by Rank and Gender, Based on 9-Month Salary
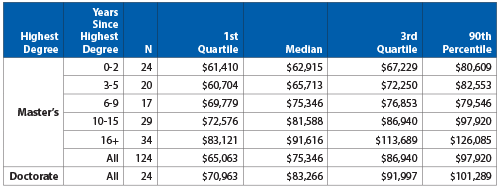
Table 7—2017–2018 Academic Nonfaculty Statisticians* by Highest Degree, Based on 12-Month Salary *Includes 133 from biostatistics, 14 from statistics, and 1 from mathematical sciences departments.
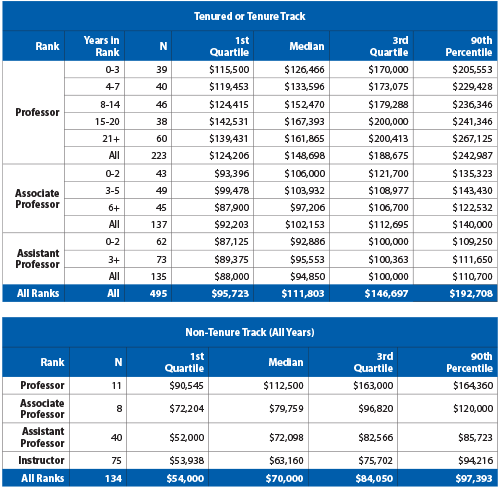
Table 8—2017–2018 Academic Faculty in Statistics Departments by Tenure Status, Rank, and Years in Rank, Based on 9-Month Salary
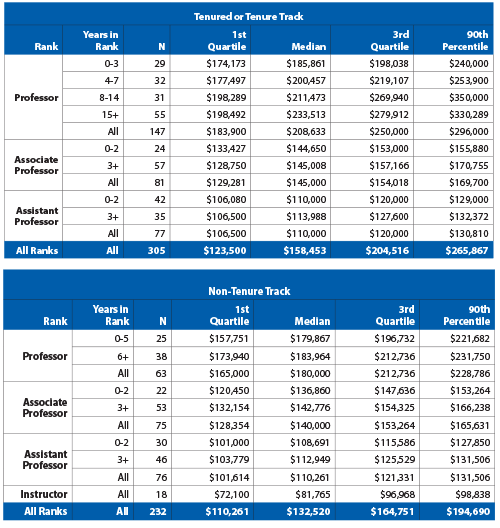
Table 9—2017–2018 Academic Faculty in Biostatistics Departments by Tenure Status, Rank, and Years in Rank, Based on 12-Month Salary
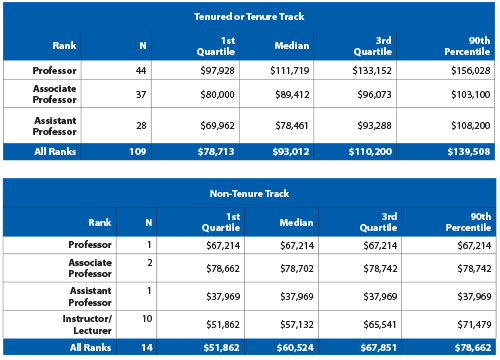
Table 10—2017–2018 Academic Faculty in Mathematical Sciences Departments by Tenure Status and Rank, Based on 9-Month Salary


 (No Ratings Yet)


