Reviewing Results from the 2009 JSM Presenter Satisfaction Survey
In general, satisfaction was high. Overall, 45% said they were very satisfied with the session type and role. Strong satisfaction was most common among presenters at invited and topic-contributed (TC) sessions (other than the discussants). Only 25% of poster presenters were so satisfied with the experience that they are very likely to give future poster presentations. Obviously, this does not bode well for efforts to boost voluntary choice of the poster presentation format unless the poster experience is somehow improved.
Although the results about strong satisfaction seem clear enough, the results about strong dissatisfaction are in the ticklish zone of rare outcomes observed on modest sample sizes. For example, even for the large columns of invited/TC papers and poster presentations, the question arises of whether strong dissatisfaction is more common among the latter than the former. Our colleague Sujit Ghosh from North Carolina State University was inspired by this table to conduct a fully hierarchical Bayesian analysis with vague priors. It looks like a great example of what I have seen Andrew Gelman urging at meetings of advisory panels to the Institute of Education Sciences. Ghosh’s graph is shown in Figure 1. From this, we see clearly that:
- Session type 1 presenters (invited and topic contributed) have higher levels of strong satisfaction and lower levels of indifferent satisfaction than the other groups. (The middle level of the three-level satisfaction scale: satisfied enough that he/she might try giving future presentations of this type again. Refers in the figure to points with a 2 in the second position.)
- Session type 4 presenters (regular contributed) have lower levels of strong satisfaction and higher levels of indifferent satisfaction than the other groups.
- Session type 5 presenters (poster) have much lower levels of strong satisfaction and much higher levels of indifferent satisfaction than the other groups.
- The satisfaction of type 2 and type 3 presenters is the most uncertain, with wide error bands.
- Strong dissatisfaction is rare.

Figure 1. Presenter satisfaction by presentation type. (Presentation types 1 through 5 correspond to the columns of Table 1, respectively, and are the first number in each set of square brackets. The second number in each set of square brackets refers to the rows of Table 1, respectively.)
What is less clear to the eye from the figure is whether strong dissatisfaction among poster presenters is really stronger than in other groups. The shrinkage procedure has brought the levels closer together across session types, and the error bands seem fairly wide. However, in a supplemental communication, Ghosh reports the posterior probability of p[5,1]>p[1,1] is virtually one (to be more exact it is 0.9946), so I think we can conclude with fair certainty that we need to somehow improve the poster presentation experience if we are to succeed in persuading more people to convert to posters.
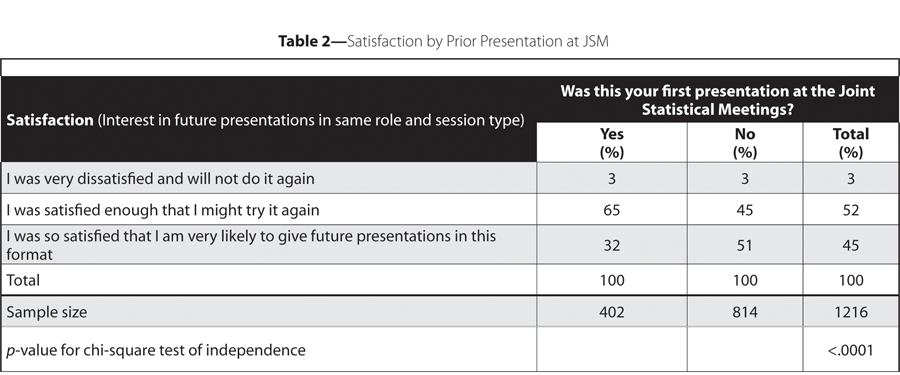
Table 2 shows how satisfaction varies by experience. Repeat presenters are much more likely to present very strong satisfaction than first-time presenters. No doubt, repeat presenters who were not pleased with their first experience screened themselves out from repeat experiences. Perhaps this indicates that we need to give a better idea to first-time presenters of what to expect from the experience. Table 3 contrasts the distributions of presentation types across first-time and repeat presenters. Repeat presenters are much more likely to be giving invited and topic-contributed talks and much less likely to be giving regular contributed talks or to be presenting posters.


 (No Ratings Yet)


