Using the Classroom to Bring Big Data to Statistical Agencies
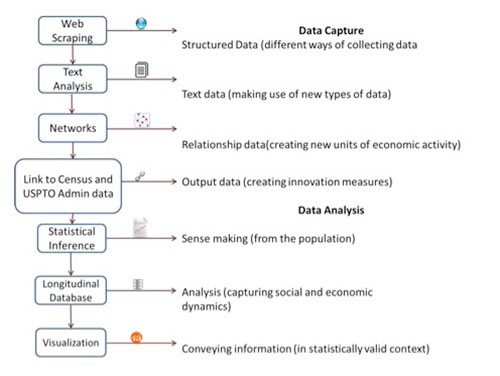
Figure 1: Schematic of course syllabus
Ron Jarmin, Julia Lane, and Alan Marco, with Ian Foster
Big Data have the potential to fundamentally change the way federal statistics are produced and disseminated. Most obviously, data types and coverage, timeliness, usability, and, of course, cost. If statistical agencies are to retain their unique role as the trusted source of statistics, they must reconsider the way data are being generated and used, lest they produce data that fail to meet user expectations and/or are too costly. Fortunately, statisticians are responding to this call to action.
In June 2013, Amstat News published a position paper from the leaders of the American Statistical Association and the American Association for Public Opinion Research has established a task force to produce recommendations for the survey industry’s use of Big Data. There is also substantial funding for research across federal agencies (e.g., the White House Big Data initiative). However, it is difficult to make use of Big Data in the federal statistical context. Staff in federal statistical agencies are stretched thin producing existing products, and concepts developed by computer scientists are often not easily translated into a social science framework.
To meet these challenges, we developed a class for the U.S. Census Bureau and U.S. Patent and Trademark Office (USPTO) to bring Big Data tools to bear on a concrete measurement task: developing new statistical measures of innovation. The task is interesting and challenging. The innovation system is complex and requires thinking hard about how to measure the creation, transmission, and adoption of knowledge using new types of transactional data on innovation activity. Since human beings are key factors in innovation—J. Robert Oppenheimer pointed out that the best way to send knowledge was to wrap it up in a human being—statistical agencies need new and better data on the supply chain feeding innovation, on developing measures of networks as potential new units of analysis, and on linking those networks to economic outcomes.
Participants in the class used data from research universities to make progress on these issues. The particular focus was on the way in which scientific ideas generated from funded research projects move to the economic marketplace. This involved using several aspects of Big Data, including:
(A) Describing the subject areas of research funding using natural language processing and machine-learning techniques, rather than manual coding
(B) Describing the production function of scientific innovation, using complex administrative records from the UMETRICS program to describe the networks of scientists and the purchases of scientific inputs for each project
(C) Associating research funding received by principal investigators with their subsequent activities using disambiguation techniques and investigating the quality of information that could be scraped from the web or generated from existing data (e.g., web-scraped CV data, API data from the Public Library of Science about Facebook postings and Twitter feeds, USPTO databases, and Census business data)
The work was preliminary, was for statistical purposes only, and all confidentiality protocols were observed.
The analysis of university financial transaction data provided new insights into the supply chain for scientific research, and into the Census Bureau’s seasonality assumptions. One team (Grant Degler, Brian Dumbacher, and Sharon O’Donnell (Census); Evangelos Xydis (USPTO)) mapped the location of suppliers for one large research university and found they were distributed across one-third of all U.S. counties. The team also exploited the fact that the transaction data were logged daily to evaluate various time series assumptions used in the Census Bureau’s seasonal adjustments.
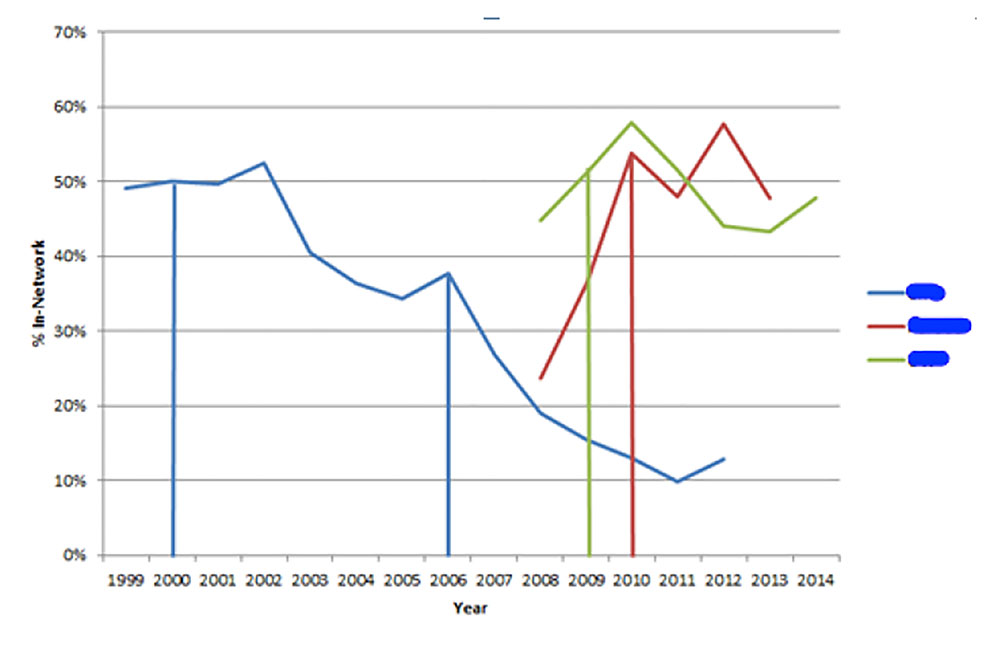
Figure 2: The pattern of collaboration before, during, and after research funding (legend suppressed for confidentiality reasons). Source: UMETRICS.
The students found it was possible to characterize dynamic scientific networks—and use them as a unit of analysis. One group of students (Chandra Erdman, Star Ying, and Mary Pritts (Census); Gerard Torres and Richard Miller (USPTO)) examined how National Science Foundation–funded research centers fostered the development of such networks. They used machine learning techniques to examine questions like: How do the networks of research centers change over time? What kinds of people—particularly graduate students, postdoctoral fellows, and undergraduate students—enter and leave the network? What do the collaborations inside and outside the center look like? How do the associated vendors change over time? They found that collaborations drop significantly after the center funding ends (Figure 2). Another team (Tyler Fox, Kelly Trageser, and Randall Knol (Census); Michael Shaver (USPTO)) also zoomed in on the networks resulting from National Science Foundation Engineering Grants. They found that although the research topics and total number of awards varied widely by institution, the academic networks that existed resulted from relatively few employees who worked on multiple grants.
Another set of students examined the link between research funding and important innovation outcomes—both patents and business startups—not by mechanical methods, but by tying them to scientific networks using Big Data techniques combined with social science. For example, although patents are often seen as a tangible measure of innovation resulting from federal funding, the direction of causality may not be clear. Does funding go to researchers who have previously patented, or does funding create researchers who subsequently patent? The team (Richard Watson, Joshua Tokle, Daniel Whitehead, and Lindsay Longsine (Census Bureau); Amanda Myers (USPTO)) examined the timing of the link between funding to all scientists on funded projects and patents; they found mixed results in establishing causality. The green lines in Figure 3 show events where awards precede patents; orange where patents precede awards (the visualization has the interesting property that the steeper the line, the closer the timeline between patenting and award).
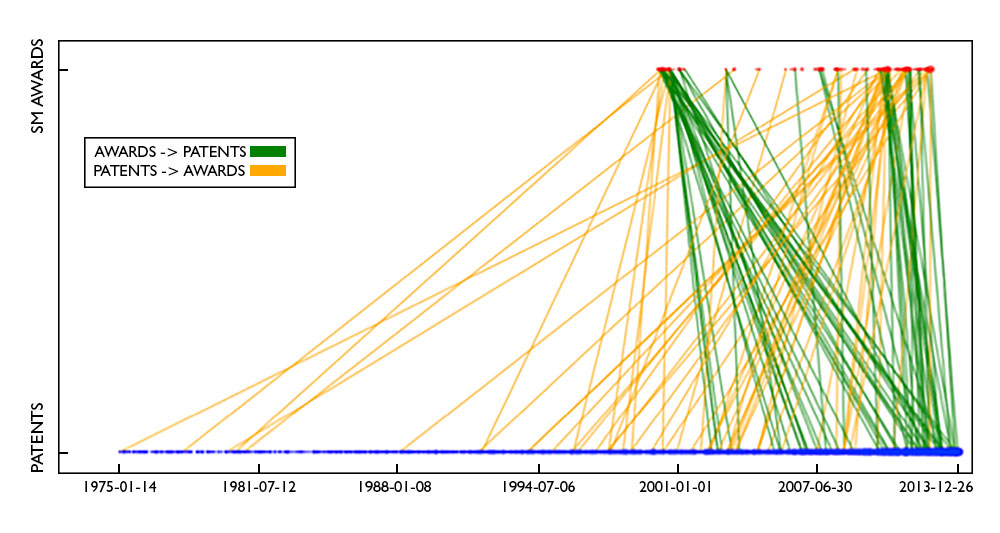
Figure 3: Visualizing the time between patents and federal funding Source: UMETRICS
Research funding is also anecdotally tied to business startups. (Kimberly Wortmann, Nick Zolas, Nathan Goldschlag, and Quentin Brummet (Census Bureau); Chris Leithiser (USPTO)) used employment data from 62 nanotechnology grants to three large research universities—with more than 1,000 faculty, students, and postdocs—and linked those data to firm-level data collected by the Census Bureau and USPTO. They found more than 250 researchers who either started up non-employer businesses or were involved in start-ups. The majority of nanotech researchers appeared to be graduate students who started consulting firms.
In sum, the Big Data class provided a number of Census Bureau and USPTO employees with new ideas and techniques that can be brought to bear on trenchant measurement issues—in this case, the study of innovation. Our hope is that the approach will energize changing the way federal statistics are collected by empowering and educating the very people who collect them.


 (2 votes, average: 5.00 out of 5)


