Academic Salary Survey: What’s Your Number?
Patricia Hall and Varghese George, Georgia Regents University, and Ron Wasserstein, ASA
This year’s academic salary survey includes both faculty and nonfaculty statisticians and biostatisticians. We received responses from 58 institutions in the United States. The data included 980 faculty and 80 nonfaculty statisticians, with gender information. The quartiles and 90th percentile are provided in the summaries, whenever possible. All percentiles are rounded to the nearest $100.
Faculty Data
The original academic faculty data set included 980 observations from 58 institutions. Of these, 119 observations were deleted, mostly because of duplications, and a few due to fatal errors. The final analysis included 861 distinct full-time faculty members in 29 statistics departments (N=469), 18 biostatistics departments (N=336), and 10 math sciences departments (N=56) from 53 institutions in the United States.
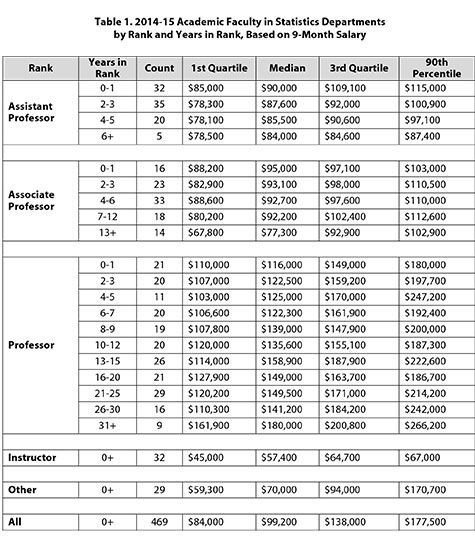
Table 1 summarizes salary information for full-time academic faculty in statistics departments by rank and years in rank, based on a nine-month salary. Table 2 provides similar information for full-time academic faculty in biostatistics departments, but is based on a 12-month salary. Table 3 summarizes salary information on full-time academic faculty in the math sciences departments by rank, based on a nine-month salary. A few cases of statistics and math sciences faculty with 12-month salaries were adjusted down by a factor of one-fourth, and a few cases of biostatistics faculty with nine-month salaries were adjusted up by a factor of one-third. The quartiles and 90th percentile are provided.


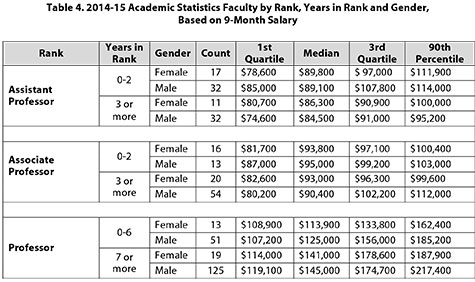
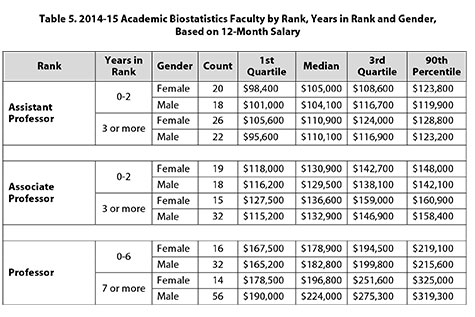
Tables 4, 5, and 6 provide similar percentiles for the groups in Tables 1, 2, and 3, respectively, stratified by gender. There were six observations that did not have gender information and, thus, were not included in the gender analysis.

Nonfaculty Data
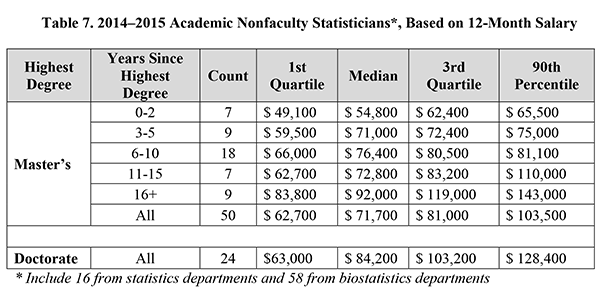
Original data included 80 observations from 14 institutions. However, one institution had only part-time nonfaculty and was excluded from analysis. The remaining 76 consisted of 24 at the doctoral level, 50 at the master’s level, and two at the bachelor’s level. The two observations at the bachelor’s level also were excluded because of the small number, resulting in a total 74 observations for the final analysis. Of the 74 individuals, 58 were from biostatistics departments and 16 from statistics departments. Table 7 provides their salary distribution, stratified by highest degree (master’s or doctorate) and years in rank.
Questions regarding this survey report should be addressed to Ron Wasserstein.


 (3 votes, average: 5.00 out of 5)
There is a typo in the first row of Table 7 (median of $4,800 is not possible given the other percentiles reported for that row). Please update with the correction. Thanks!
Katie,
Thank you, the correct Median is $ 54,800. We have updated the table.
CICATRICES REDUCCIÓN PEZÓN
Academic Salary Survey: Whats Your Number? | Amstat News
Welcome!
Amstat News is the monthly membership magazine of the American Statistical Association, bringing you news and notices of the ASA, its chapters, its sections, and its members. Other departments in the magazine include announcements and news of upcoming meetings, continuing education courses, and statistics awards.
ASA HOME
Departments
Archives
ADVERTISERS
PROFESSIONAL OPPORTUNITIES
FDA
US Census Bureau
Software
STATA
QUOTABLE
“ My ASA friendships and partnerships are some of my most treasured, especially because the ASA has enabled me to work across many institutional boundaries and
with colleagues from many types of organizations.”
— Mark Daniel Ward
Editorial Staff
Managing Editor
Megan Murphy
Graphic Designers / Production Coordinators
Olivia Brown
Meg Ruyle
Communications Strategist
Val Nirala
Advertising Manager
Christina Bonner
Contributing Staff Members
Kim Gilliam
Contact us
Amstat News
American Statistical Association
732 North Washington Street
Alexandria, VA 22314-1904
(703) 684-1221
www.amstat.org
Address Changes
Amstat News Advertising