Who Is the American Statistician? Or, Is It Data Scientist?
ABOUT THE AUTHOR
Michael Latta holds a master’s degree and PhD in industrial and organizational psychology and statistics from Iowa State University. He is a professor in the department of marketing and hospitality, resort, and tourism in the Wall College of Business Administration at Coastal Carolina University. On the business consulting side, he is the executive director of YTMBA Research and Consulting, a firm specializing in new product development in international markets and predictive analytics.
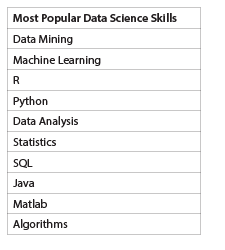
Table 1—Top 10 Skills Listed by Data Scientists on LinkedIn
[John] Tukey started the statistics and data analysis reformation in his [Annals of Mathematical Statistics] publication, titled “The Future of Data Analysis.” More recently, David Donoho summarized the 50-year discussion of science and statistics, and the story of how data science was enabled through the marriage of technology in the form of the young discipline of computer science and the mature discipline of statistics was told by Gil Press in his Forbes piece, titled “A Very Short History of Data Science.” The name “data science” is now the discipline charged with utilizing Big Data. The role of statistics in data science is also an ongoing debate. Making sense of who is a Data Scientist and who is a Statistician has been debated by Scientists, Statisticians, Librarians, and Computer Scientists recently. However, after much debate, the definitions of Data Scientist, Statistician, Business Analyst, Master Data Manager, and Data Engineer—among others—are still in flux.
Importance of Data Science to Job Growth
The economic importance of the emergence of data scientist as a job title is illustrated in LinkedIn’s 2017 US Emerging Jobs Report. Of the top 20 emerging jobs, Data Scientist is second on the list.
What Skills Do Data Scientists Say They Have?
In an initial exploration of Data Science as a job title, Ferris Jumah looked at what skills people with the title “Data Scientist” have listed on their LinkedIn profiles and aggregated the top 10 skills by occurrence after correcting the frequencies using TFIDF. In text retrieval, TFIDF is short for term frequency-inverse document frequency. It is a numerical statistic that reflects how important a word is to a document.
Jumah then created the top 10 frequency list in Table 1 and explored the relationships among these skills by representing and visualizing them as a network, shown in Figure 1.
Three themes common to the profiles are the following:
- Approach data with a mathematical mind set
- Use a common language to access, explore, and model data
- Develop strong computer science and software engineering backgrounds
In February 2015, Mark van der Laan wrote a “Dear Amstat News” letter taking the position that Statistics is a Science, not an art, and the way to survive is to realize that truth is at the heart of Data Science. In that position statement, van der Laan took exception to George Box’s well-known comment, “[A]ll models are wrong, but some are useful.” What Box actually wrote in the first iteration of this idea of scientific correctness was the following:
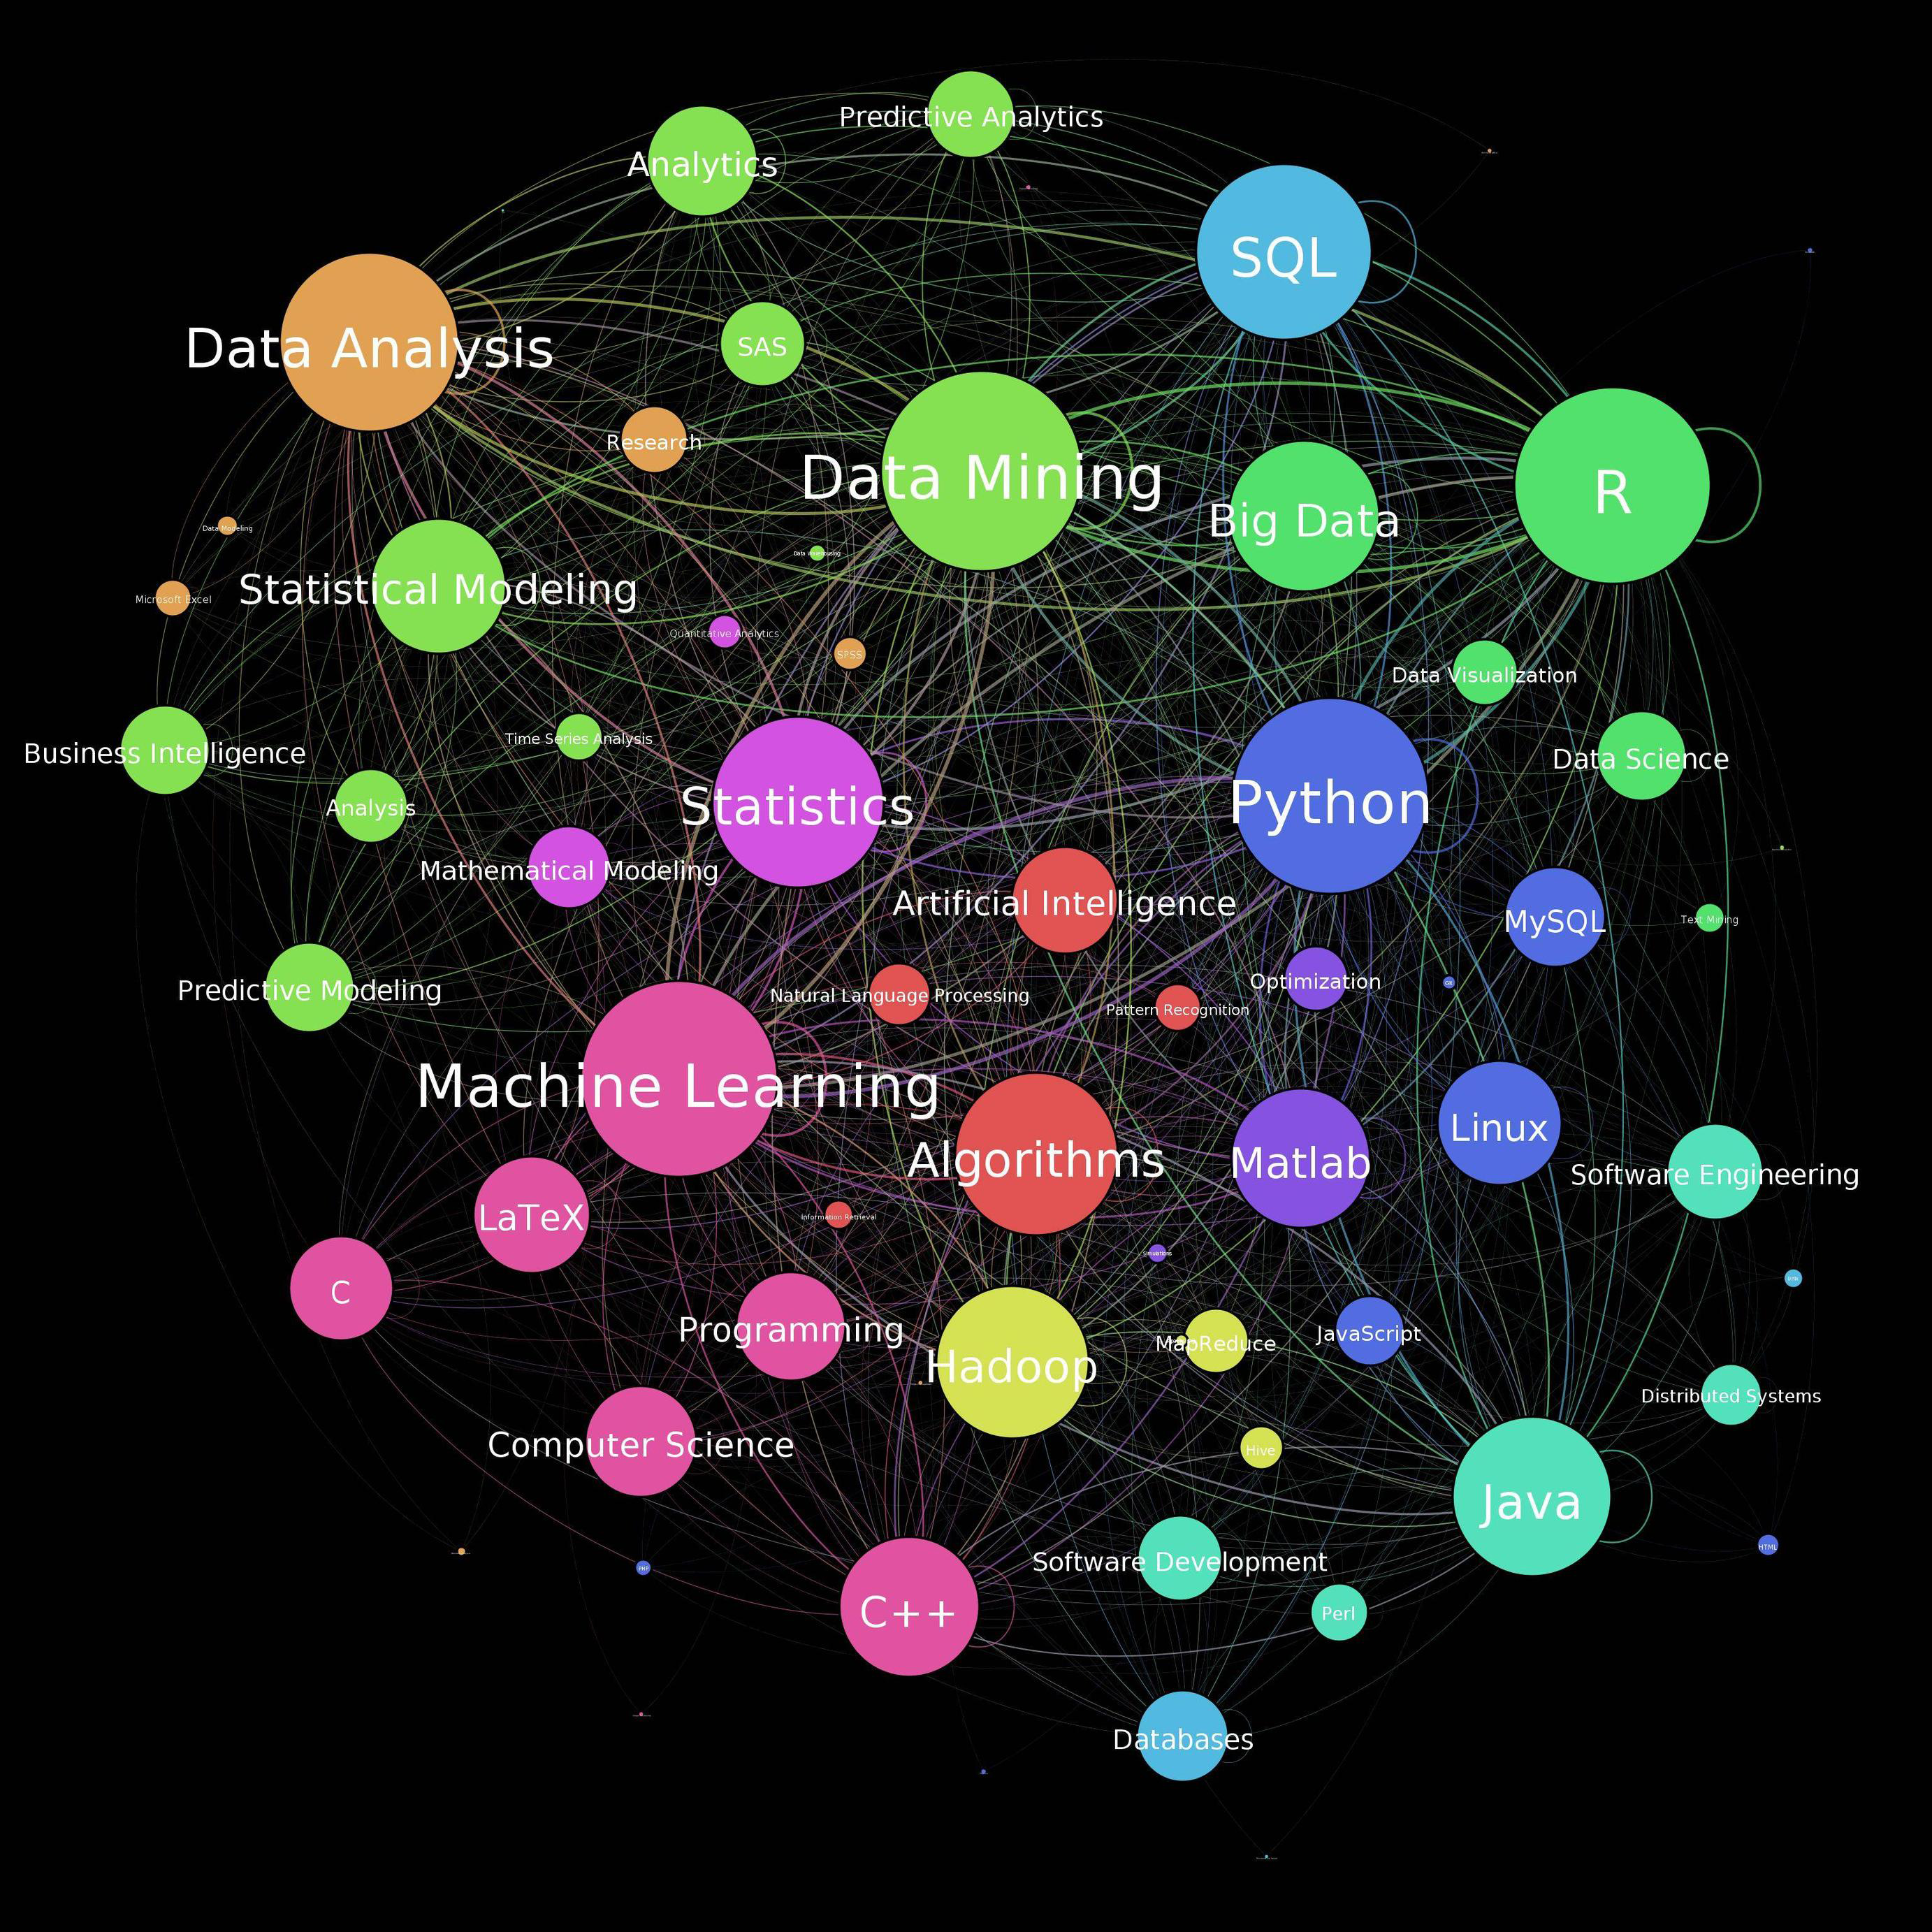
Figure 1: Network of data scientist skills
What Box was really talking about in this classic article was the ideal balance between theory and practice, where the ‘Advancement of Learning’ involves ‘An Iteration Between Theory and Practice’ followed by ‘A Feedback Loop,’ which motivates true scientific discovery. However, the ideal balance was typically not in play and the real process showed flaws of imbalance. He named those flaws as follows:
Mathematistry is characterized by development of theory for theory’s sake, which since it seldom touches down with practice, has a tendency to redefine the problem rather than solve it. Typically, there has once been a statistical problem with scientific relevance but this has long since been lost sight of.
Two responses to van der Laan’s letter also appeared as a “Dear Amstat News” letter, one from Michael Lavine and one from Christopher Tong. These letters were rebutted in a third letter by van der Laan. The real value of these three letters appeared in three comments that were later posted as part of a discussion.
One of these comments from Richard Browne describes a real-life legal situation, as follows:
Georgette Asherman made a second comment:
The arguments about Statistics and Science may never end, but we already have jobs and professionals who define themselves as Data Scientists, which leads to a new question.
Who Do Statisticians Say They Are?
One may legitimately ask, “Who do Data Scientists say they are?” At the 2017 Conference on Statistical Practice, this author presented a poster that was heavily discussed and commented upon there. In fact, it generated more traffic and discussion than most other posters at the conference.
That poster had the following purpose and goals. In August of 2015, the ASA published a statement on the Role of Statistics in Data Science. The purpose of that statement appears in its final sentence: “The ASA aims to facilitate collaboration between statisticians and other data scientists and thus enable them to achieve more than they could on their own.”
Ron Wasserstein, executive director of ASA, discussed the statement in his blog and outlined some of the ASA’s efforts to “facilitate further collaboration between statisticians and other data scientists.”
The poster was aimed at offering the audience an analysis of what Statisticians, Data Scientists, Data Engineers, and those practicing Predictive Analytics say about their jobs, relationships, and their roles. A further analysis of what ASA members say about these issues is summarized here.
Data Collection
Data were collected from the ASA Connect Digest Online in a thread on the definition of Data Scientist posted from July 11, 2016, at 06:02 to July 28, 2016, at 09:04. There were 18 participants in the discussion, generating 35 posts. Two participants generated seven posts, five generated two posts, and 11 generated only a single post.
After collecting the data from the online blog, the analysis involved the usage of terms arising from recent controversies such as what are statistics, data science, predictive analytics, and data engineering being discussed at the time in the ASA Connect Digest Online. This online activity appeared in the ASA Blog Posts with the title Data Science and Statistics. The analysis was directed at learning about what the terms Data Science, Statistics, Analytics, and Data Engineering mean to facilitate 1) communication with clients, collaborators, and customers; 2) having a positive impact on clients and their business operations; and 3) having a positive impact on the organizations where those clients, collaborators, and customers live and work. The next step involved removing all capitalization and punctuation (with the exception of possessive apostrophes). The final step was to create a word cloud using the text and a program named Wordle.
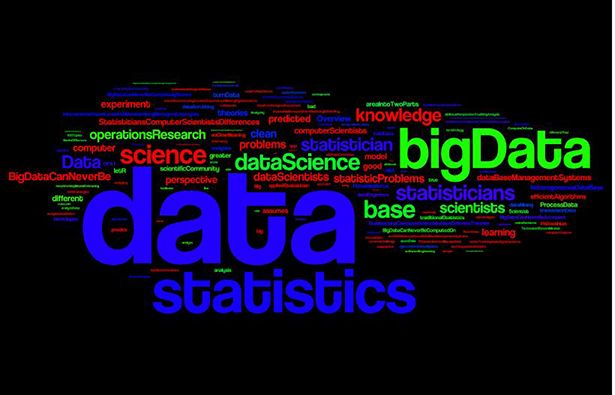
Figure 2: Visualization of ASA blog posts
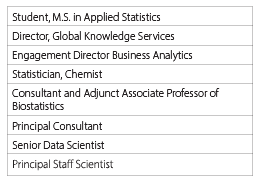
Table 2—Signature Identity Title
Data Visualization
The visualization of the text data is presented in Figure 2. Word clouds give greater prominence to the visualization of words that appear more frequently in the source text, where prominence is defined by size and location.
The participants in the blog typically signed off with only their names. However, some also named their identity with a title, as indicated in Table 2.
It’s All About the Data
Primarily, it’s all about the data in both the ASA Connect Digest postings and the Data Science Network. Similarities between the ASA Connect Digest and the Data Science Network include the following:
• Data
• Big Data
• Data Mining
• Statistics
Discussion
Tukey coined the term “bit,” which Claude Shannon used in his paper, “A Mathematical Theory of Communications.” In Tukey’s work, done for the Army Research Office and titled “The Future of Data Analysis,” Tukey foreshadowed the emergence of Data Science when he wrote the following:
Later, Tukey published his widely used text Exploratory Data Analysis, where he wrote the following:
It seems Data Scientists and Statisticians can coexist and work to advance methods of understanding data and perhaps practice science together.


 (1 votes, average: 4.00 out of 5)


