ASA’s First Survey of Master’s Graduates Provides Insight Into Job Market Demand, Degree Satisfaction
Salim George, Doctoral Candidate and Intern, Center for Evaluation and Assessment at the University of Iowa; Daniel Elchert, Science Policy Fellow, ASA; and Steve Pierson, Director of Science Policy, ASA
The ASA’s first follow-up survey of master’s graduates is complete. The results provide insights into starting salaries, hiring sectors and companies, most frequently used technical and nontechnical skills, and undergraduate training—all valuable information for current and prospective students, statistics and biostatistics departments, and new graduates.
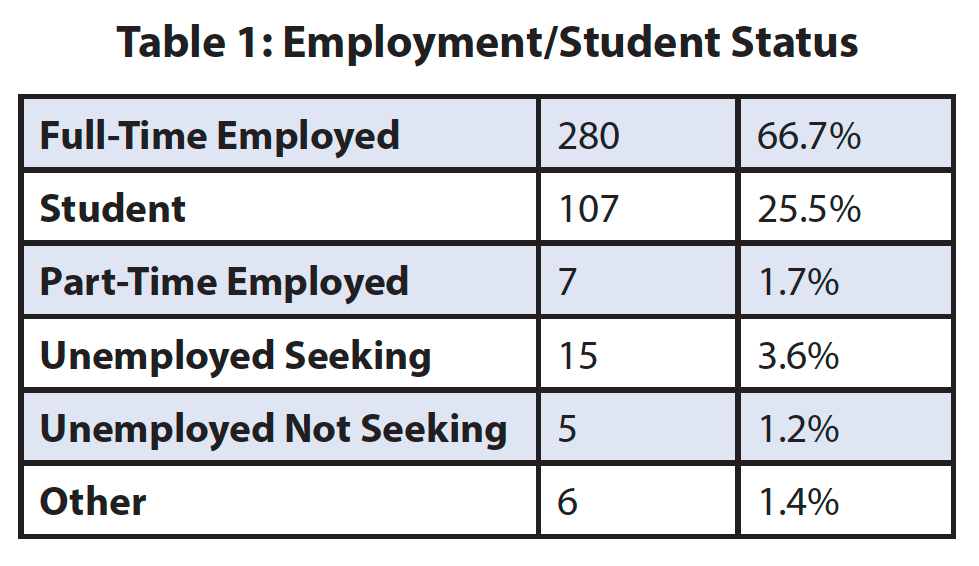
The respondents generally fall into two categories. Of the 420 who provided their employment and enrollment status as of March 6, 2019, two-thirds were employed full time and one-quarter were enrolled full time in degree programs, as reported in Table 1. Twenty of those employed full time also reported they were enrolled as full-time students (but are only included in row one of Table 1). In this summary, we’ll start with a report of those directly entering the job market.
Employed
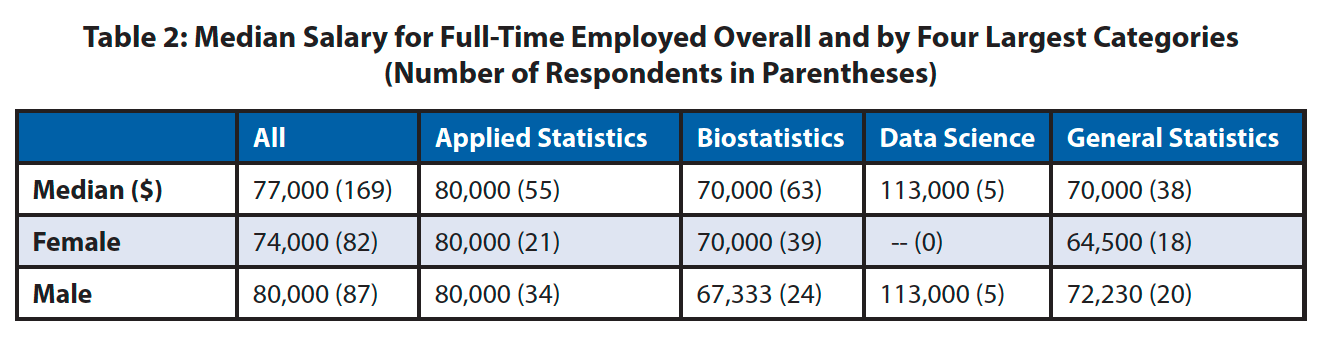
For the 172 full-time employees who reported their annual salary, the median was $77,000, with those who categorized their degree in applied statistics having a higher median. As shown in Table 2, the median for females with a general statistics master’s was markedly lower than for corresponding males, an important finding that requires further analysis.
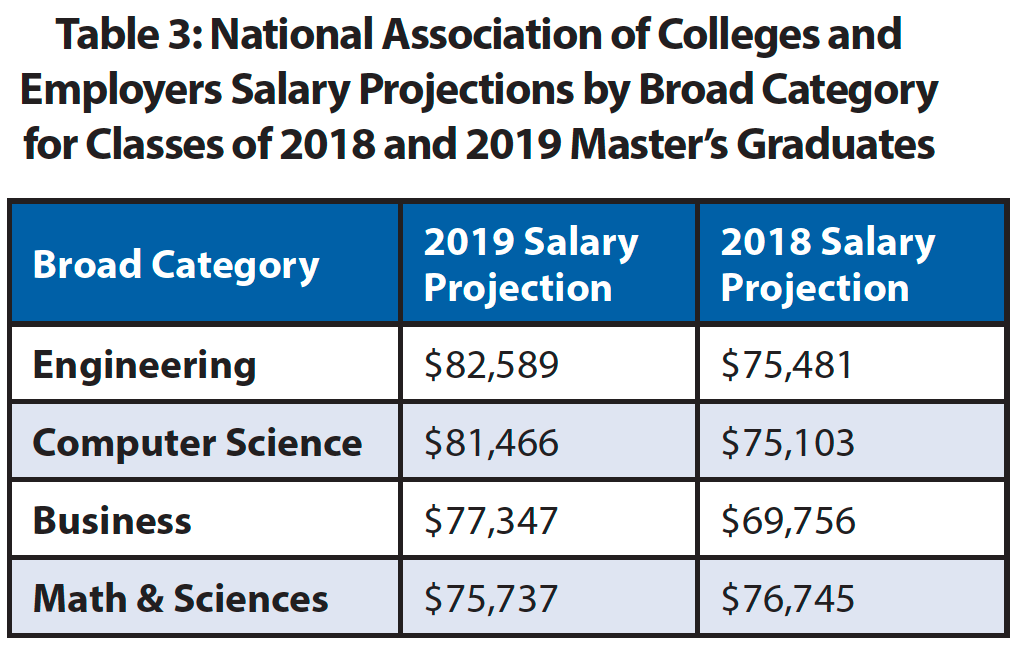
The overall median salary of $77,000 compares well with 2018 salaries projected for the broad categories of engineering, computer science, business, and math and sciences by the National Association of Colleges and Employers (NACE). See Table 3 showing the 2018 and 2019 NACE projections.
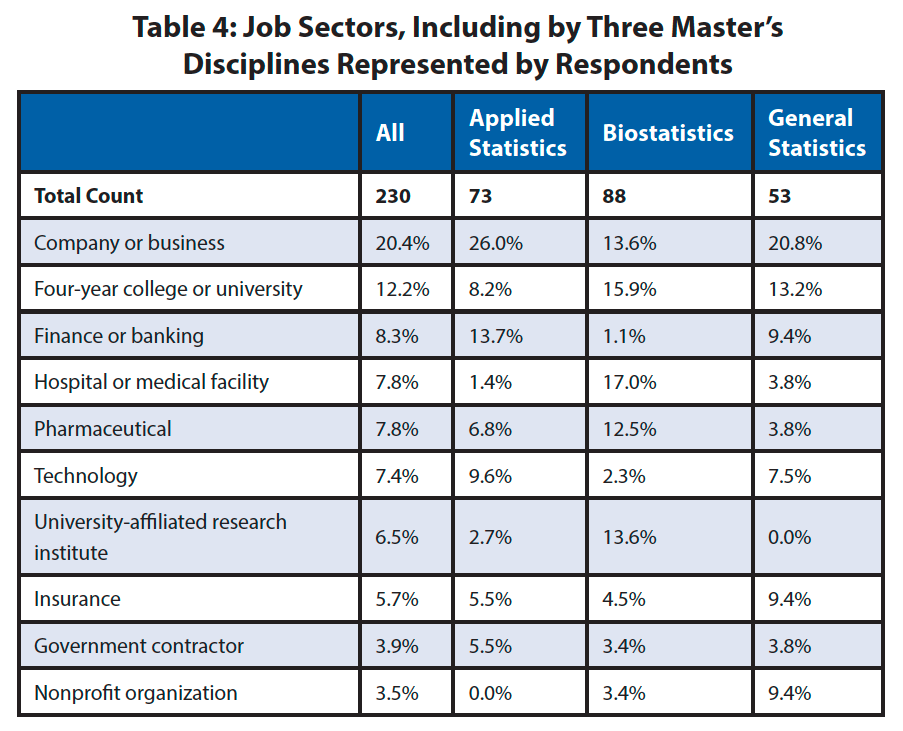
The top sectors respondents reported working in were companies/businesses (20%), four-year colleges or universities (12%), finance or banking (8%), pharmaceutical (8%), hospitals or medical facilities (8%), technology (7%), university-affiliated research institutions (7%), and insurance (6%). As shown in Table 4, there is some variation for master’s discipline where hospital and medical facility is the top sector for those with a biostatistics degree.
As was the case for the ASA statistics bachelor’s survey, there was tremendous diversity in the companies for whom master’s graduates went to work and in their job titles. For the 180 employed respondents who provided the name of their employer, there were 165 unique names (See the supplemental materials linked at the end of this article). Similarly, there were more than 130 unique—although similar—job titles. The most common were data analyst (11), biostatistician (10), data scientist (9), biostatistician I (6), statistician (6), biostatistician II (5), statistical analyst (4), and research associate (4).
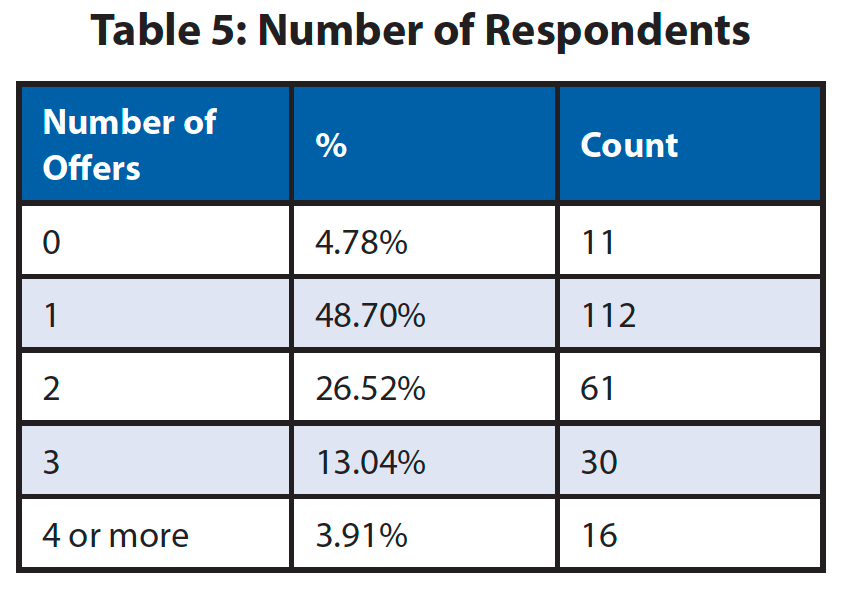
Respondents were also asked the number of job offers they had at the time they accepted the position. Table 5 shows their responses, with one being the most common for the 230 who replied.
For how influential graduates felt their statistics-related master’s degree was in securing their current position, 88% of respondents responded somewhat or very influential, with 66% reporting very influential. Eighty-seven percent reported being somewhat or very satisfied with their position, with 51% reporting very satisfied. Job security was another element of their position that stood out in terms of satisfaction: 89% reported feeling somewhat or very satisfied with their position in terms of job security, with 64% reporting very satisfied.
Three general themes characterized the descriptions of job search experiences and how the graduates located and secured their positions. Thirty-four percent of 173 respondents mentioned the role of online postings and websites such as LinkedIn and Indeed in helping land a job. Example responses include the following:
- “Browsed websites such as Indeed and LinkedIn; found posting for current job on LinkedIn and was offered a position within three weeks of applying.”
- “Indeed.com was helpful in locating jobs related to my field in my area. I applied to approximately 30 positions, heard back from a third of them, and interviewed at three.”
The second theme, noted by 17% of respondents, was the importance of personal and professional social networks in helping to secure a position. Example responses for this theme include the following:
- “Having previous job experience, I leveraged my network to find positions and companies to apply to.”
- “Networking, networking, and networking.”
Finally, 16% of respondents also indicated they already had a position before beginning the master’s program and continued on in that position after completing their degree.
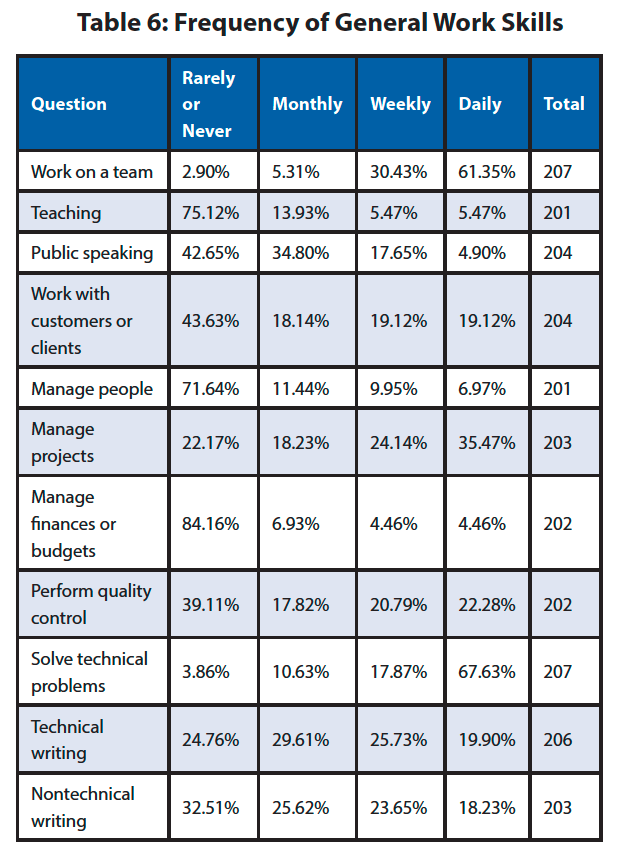
The survey sought to understand the nature of the work undertaken by master’s graduates. Sixty-eight percent reported solving technical problems on a daily basis, and 61% reported working on a team as often, as shown in Table 6. At least 40% of respondents reported engaging in technical writing, nontechnical writing, and project management on a weekly basis.
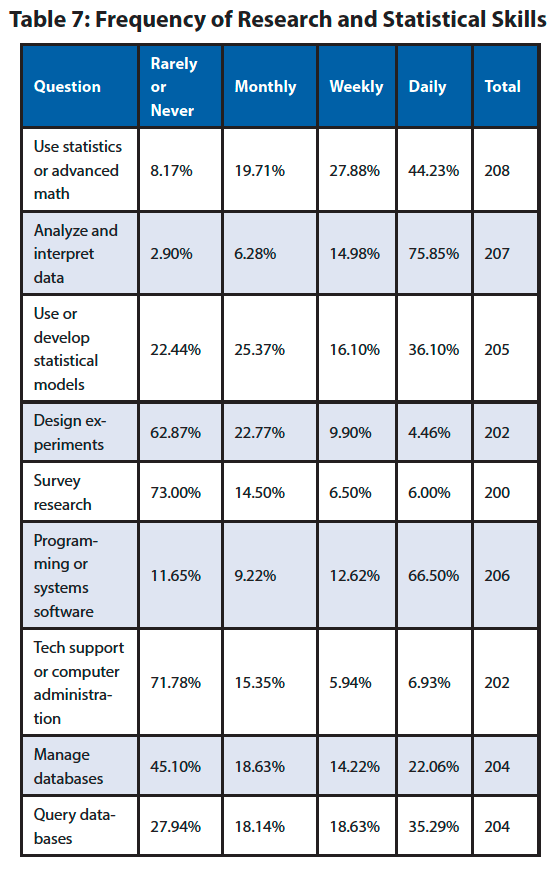
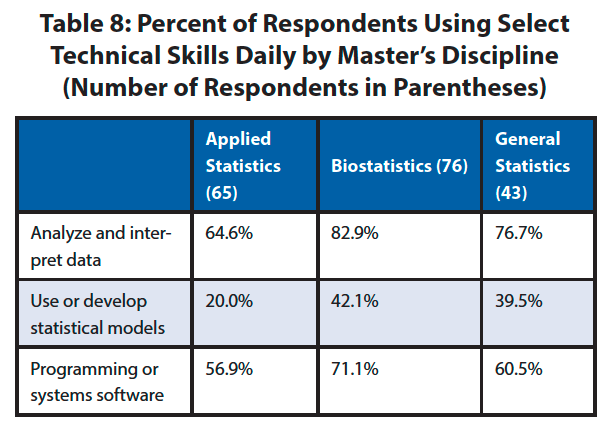
The most frequently used technical skills were analyzing/interpreting data and programming or systems software. Seventy-six percent reported using the former on a daily basis, while 67% reported the latter, as shown in Table 7. The next most-often-used skills—performed at least weekly by half the respondents—were statistics or advanced math, statistical model use or development, and database querying. Roughly half reported doing database management on a monthly basis. There is some variation by master’s discipline for use of technical skills. For example, as shown in Table 8, for three of the top technical skills used on a daily basis, those with a biostatistics master’s degree had the highest percentage of daily users.
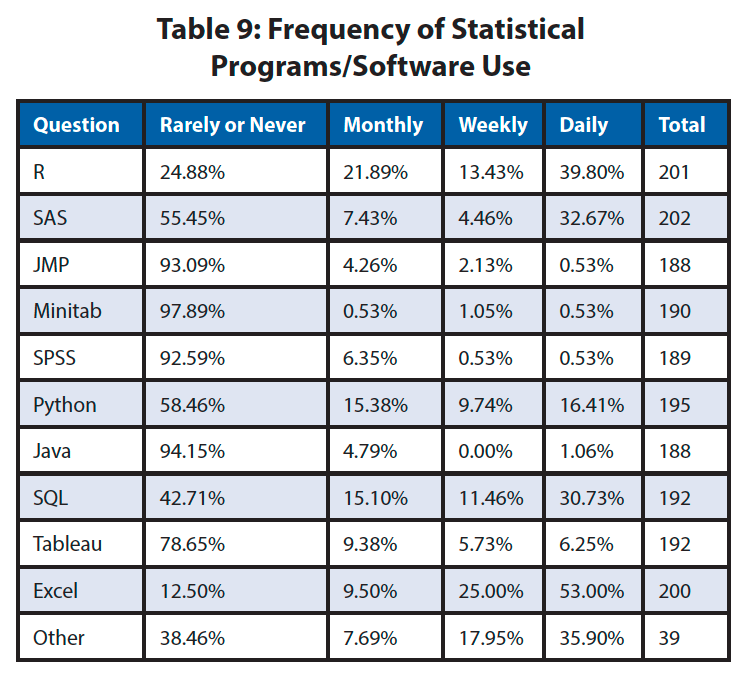
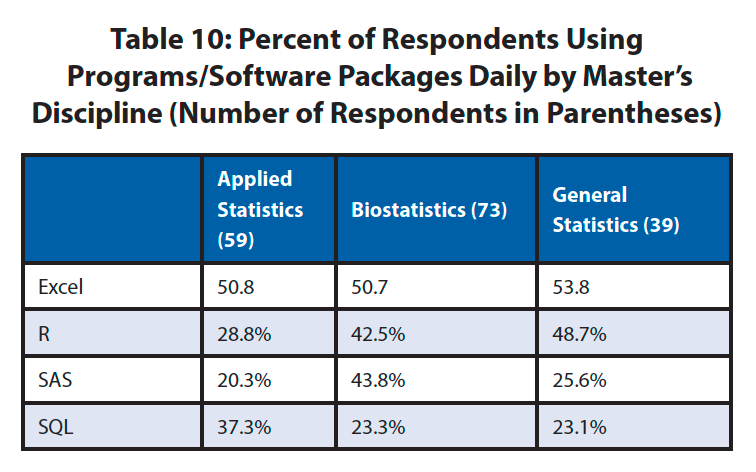
The top software programs in terms of daily use were Excel (53%), R (40%), SAS (33%), and SQL (31%), as shown in Table 9. In contrast, the software programs reported to be rarely or never used in their positions were Minitab (98%), Java (94%), JMP (93%), and SPSS (93%). In the “other” category, three reported using powerbi, Spotfire, and Stata and two reported using MatLab and JavaScript. When examined by master’s discipline (as in Table 10), Excel is the most used on a daily basis for each of the top-three degree categories of the respondents. R was the second-most used for statistics and applied statistics, while SQL was second-most used for applied statistics.
Respondents were then asked to describe additional technical or nontechnical skills they perform on a weekly or daily basis. Of the 35 responses, the most frequently appearing skills were data visualization (6); data management, cleaning, or formatting (3); machine learning (3); mentoring students in statistics (3); and programming skills (2). Refer to the supplemental materials section online to see all responses.
Students
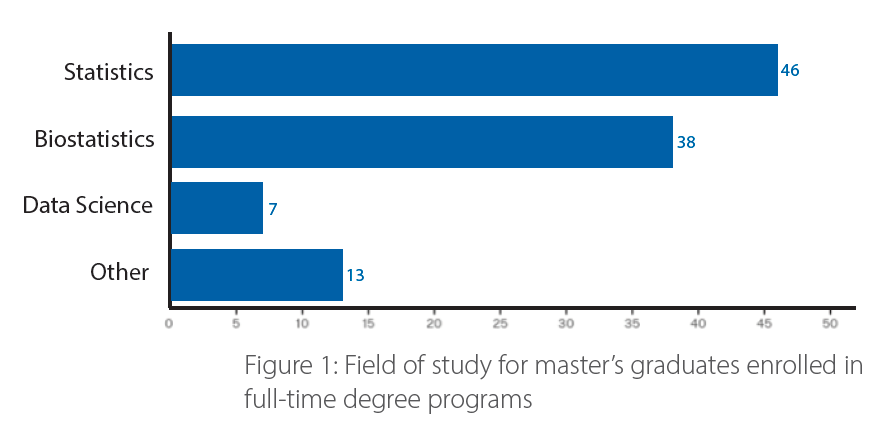
For the graduates who were enrolled in a full-time degree program, 83 were in a doctorate program, 18 in a master’s, and three in other programs. As shown in Figure 1, they were primarily studying statistics or biostatistics. Fifty-six of those in a doctorate program stayed in the same general field—statistics or biostatistics—as that of their master’s degree, perhaps suggesting they were already enrolled in a doctoral program. Five of the respondents enrolled in a master’s program were studying data science. The “other” categories of study were health economics and epidemiology, computational social science, mathematics, educational statistics, math finance, marketing, forest biometrics, bioinformatics, health, industrial engineering, and epidemiology.
Reports on Master’s Studies Experiences
Respondents were generally satisfied with their master’s degree training. Eighty-seven percent of respondents reported they agreed or strongly agreed that their master’s program prepared them to effectively analyze and interpret data critically using statistical models, with 46% strongly agreeing. Seventy-six percent agreed or strongly agreed their master’s program prepared them to effectively communicate—both orally and in written form—results of statistical analyses to a variety of audiences, with 35% strongly agreeing.
Respondents were asked to comment on what they might do differently looking back at their master’s education. The responses to this question varied, but one group of responses could be characterized as indicating a desire to have taken better advantage of the resources and educational opportunities available to them in the program:
- “I would take up more courses in applied statistics and data science.”
- “I would take a Bayesian class and learn more statistical techniques. Other than this, I am very satisfied.”
Another cluster of responses expressed wishing they had learned more related to coding, computer programming, and statistical/database software:
- “I would have done more programming in SAS and learned SQL and how to write macros.”
- “Do more coding learn more useful topics like machine learning algorithms.”
Finally, a number of respondents wished they had sought more experience within their industry of choice and real-world applications of their degree program:
- “I would have tried to analyze more ‘real’ [data sets] to learn how to better do that for future employment.”
- “More practice with mock real-life scenarios of statistical consultations.”
All the responses can be found in the supplemental materials online.
Respondent Demographics
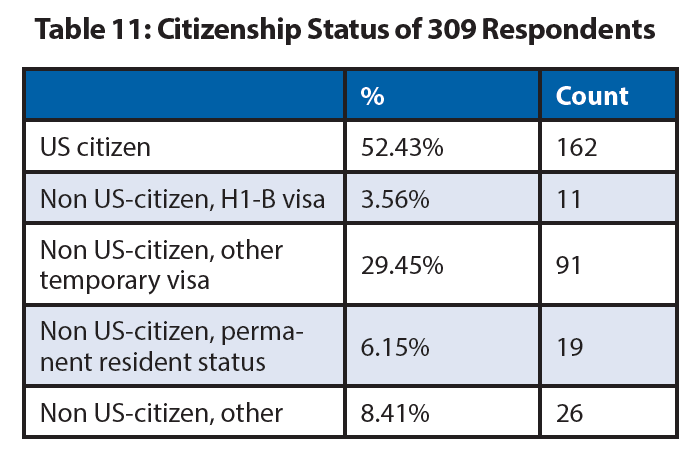
Of the 311 sharing gender, 48.2% are female, 50.5% male, and 1.3% prefer not to say. The median age of the respondents at the time of master’s receipt was 27, and the average age was 29. For the 309 students providing citizenship status, 52% were US citizens, as shown in Table 11. For respondents who are not US citizens, 90 are from China; six from India; 10 from other Asian countries; eight from Africa; six from South America; and one or two from Australia, Europe, and North America. Respondents were not asked for race or ethnicity information.
For a comparison of how the respondent demographics of this survey compare with the overall population, we can compare the survey data with data from the National Center for Education Statistics (NCES) for the most recent year data is available (2017). [The ASA examines annually the NCES degree completion data and posts the statistics and biostatistics data.]
There were approximately 4,000 statistics and biostatistics master’s graduates in the US in 2017, so this survey had respondents from roughly 10% of the 2018 graduating class. The respondents gender makeup matches well with that of the 50% of the overall population. With statistics master’s graduates outnumbering biostatistics master’s graduates by more than a factor of four, biostatistics is overly represented by the respondents. US citizens and permanent residents are also over represented in this survey’s respondents, since they have only accounted for 40% of the overall master’s degrees in recent years.
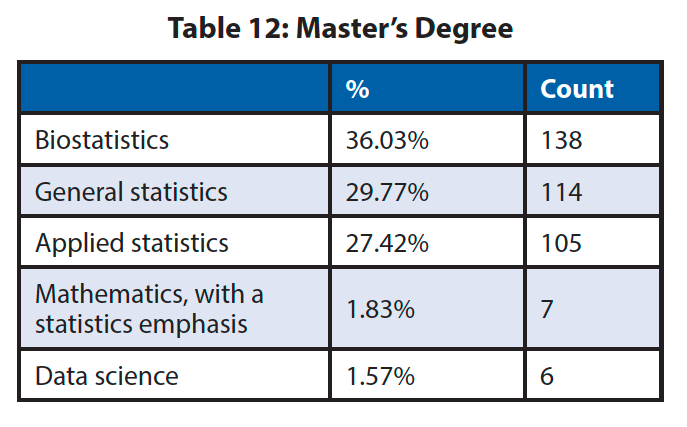
For the 383 respondents providing the degree field for their master’s, biostatistics was especially well represented, as shown in Table 12.
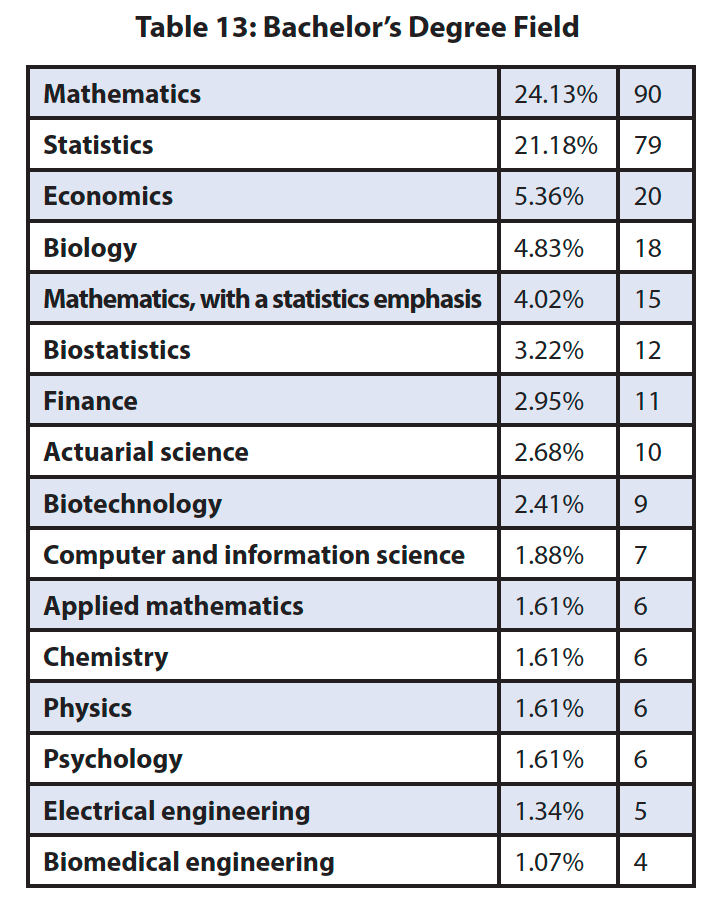
Three-hundred-seventy-three respondents reported a remarkable 63 bachelor’s degree fields, the most common being mathematics and statistics (see Table 13). Nearly 45% of the respondents had an undergraduate degree in a field other than mathematics and statistics.
The universities with the most graduates who participated in the survey were University of Michigan (24), Duke University (19), Texas A&M University (17), The George Washington University (16), Georgetown University (16), University of Kentucky (16), The University of North Carolina at Chapel Hill (16), Boston University (15), Carnegie Mellon University (14), and Columbia University (14).
Summary
As was done for the bachelor’s survey results the previous two years, departments represented by five or more respondents will receive department-specific reports. The ASA plans to repeat this survey every two years. Please send us your suggestions for the next survey.
Survey Basics and Logistics
The American Statistical Association contracted the Center for Evaluation and Assessment at the University of Iowa (CEA) to help develop and distribute the survey. Using the ASA’s bachelor’s survey as a template, CEA built the survey in Qualtrics in preparation for online distribution. The ASA provided a list of master’s programs and contact information. CEA contacted these master’s programs and provided them with links to the survey to be distributed to master’s degree recipients.In total, there were 463 respondents who indicated having earned a master’s degree in statistics or a statistics-related field during the 2017–2018 academic year. Not all completed the entire survey.
About 211 universities with statistics and biostatistics departments across the US were contacted via email to participate in the survey. Of these universities/distinct campuses, 83 were represented in terms of respondents who reported having earned a master’s degree in statistics or a statistics-related field during the 2017 – 2018 academic year.
The supplemental materials listed below are available for download:
Questionnaire
Participating Universities
Job Titles
Companies Employing Graduates
Career Center Use
What I Would Have Done Differently
Advice for Current Students, Additional Comments
Job Search Experiences
Job Search Challenges
Other Technical and Nontechnical Advice
Other Experiences or Training
Raw Data


 (No Ratings Yet)


Hurrah, that’s what I was exploring for, what a data!
present here at this weblog, thanks admin of this
web site.