Response to ‘Demystifying Apportionment Computations for the US House of Representatives’
Michael Fay, ASA Member
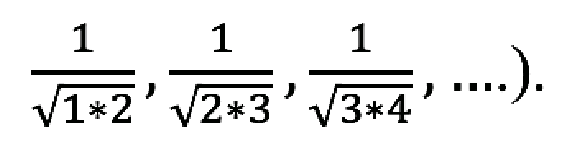
I am writing about Tommy Wright’s informative article about apportionment computations for the US House of Representatives in the July 2021 Amstat News. The seemingly simple problem of apportioning representatives according to their population is not so obvious, and I enjoyed reading about the clever algorithm that uses tables of priority values (columns of state populations multiplied by respectively,
Rob Santos’s article in the same issue has inspired me to write a response, since he wrote of the importance of speaking up when you have a different perspective. My perspective is as a US citizen with no voting representative in the US House of Representatives. Many people who live in the US do not know that the 691,533 (population is from the April 1, 2020, census) people from Washington, DC, have only a non-voting member of the House of Representatives and no senators.
Wright’s article focused on the computational method to apportion members to the House, as required by law. I found myself thinking of a more theoretical democratic ideal, where each person in the US would have equal representation. Of course, this ideal was never a part of the founding US laws, despite the claims in the Declaration of Independence about all men being created equal. This is clear when we examine the first full sentence of Article 3, Section 2, Clause 3 of the US Constitution (bold parts were not included in Wright’s article):
We see from the bold section that the founding document is not a modern democratic ideal because indigenous [people] are not counted. Further, each enslaved person is counted as three-fifths of a person, is not allowed to vote, and, in fact, their enslavers get more representation from their votes because of enslaving them.
The US has made progress since that time, with slavery and involuntary servitude (except as a punishment for a convicted crime) ended by the 13th amendment. The right to vote was expanded (in principle) by constitutional amendments (the 14th and 15th amendment included males regardless of “race, color, or previous condition of servitude,” the 19th amendment included women, and the 26th amendment included 18–20 year olds).
Although the 15th amendment was ratified in 1870, further laws were needed to enforce those rights (e.g., the 1965 Voting Rights Act). By 1924, Native Americans could have dual citizenship, and, by 1948, they had the right to vote regardless of whether they live on a reservation or not in Arizona and New Mexico (see Page 31 of Linda Monk’s The Words We Live By: Your Annotated Guide to the Constitution).
A full discussion on the quest for justice in voting rights and representation is too much for this letter, but I thought a simple theoretical democratic ideal representation would be pertinent for Amstat News readers.
An ideal representation could be to have the federal legislative power distributed proportional to the populations living in their respective states or the District of Columbia (including US citizens from those areas currently living out of the country). We use the April 1, 2020, US Census apportionment population (plus the DC population; see Tables 2 and 3).
We could operationalize the federal legislative power by having half go to the Senate (100 senators, 2 from each state) and half going to the House of Representatives (435 voting members). In our calculations, we will give no power to nonvoting members. Then, for each of the 50 states, we define the proportion of federal legislative power as
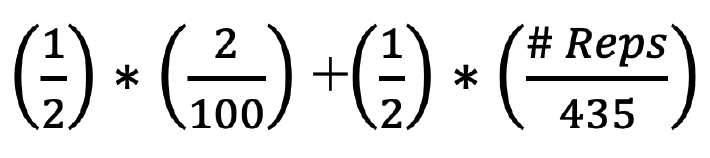
and we compare this to the ideal proportion of federal legislative power as the proportion of the population in each of the 50 states or DC by the April 1, 2020, Census apportionment counts (but with the DC population included). To compare relative power, we take the ratio of the percentage of federal legislative power over the ideal. We sort the data from the least powerful per person to the most powerful compared to the ideal (see Table 1).
For example, each resident of Wyoming has 6.4 times more power than if their power was proportional to their population size, while each resident of California has 0.58 times the power they would have gotten if given power proportional to their population size. Those in the District of Columbia have no federal legislative power.
This ideal is, of course, just one theoretical ideal for representation, and other people (e.g., those from Puerto Rico and other US territories) may have ideas for a better, more just, representation. Like all good democracies, the US allows for changing of its laws, including how its representatives are composed, and it allows for its people to express their ideas of how to change them. So, this exercise of imagining a more just democracy is, in fact, an example of a well-functioning democracy. Of course, the real ideal is changing the laws to make it better.


 (No Ratings Yet)


