Stephanie Shipp: ‘Democratizing’ Data Science to Serve the Public Good
Kim Gilliam, ASA Marketing and Communications Coordinator
Stephanie Shipp’s Arlington, Virginia, office overlooks the Potomac River and offers a sweeping view of the Washington Monument and other familiar landmarks of Washington, DC—a town she knows well from her days at the Federal Reserve Board, Bureau of Labor Statistics, US Census Bureau, and National Institute of Standards and Technology.
Today, Shipp is the interim director and a professor at the Social and Decision Analytics Division (SDAD) within the Biocomplexity Institute at the University of Virginia. Working with Sallie Keller, the founding director, she built and developed the division, which was purposely located in the DC metropolitan area because of its proximity to local, state, and federal policymakers. Shipp and Keller’s vision of “democratizing” data science to serve the public good fuels their mission: To provide evidence-based insights to change the way communities make policy to improve lives at the local level.
“When we talk about community analytics, we primarily work with local government officials,” Shipp says. “They are passionate about their work and making sure that they’re meeting the needs of all people, not just a few, especially the more vulnerable populations. Local officials truly care about their constituents. You hear this concern in every conversation we have.”
Connecting the Data
“Local officials are eager to make data-informed decisions, but they often don’t have the resources to do that,” Shipp says. She recalls working with the Arlington County fire chief, who sought to use his data to improve his “situational awareness” and make better decisions. For example, one of his concerns was to ensure their limited number of medical units were in the right place at the right time of day. He had several silos of data from such places as the call center, where they deployed their units, and after-action reports.
“He had a lot of data, but none of it was connected,” Shipp says.
“We undertook the process to statistically link these data by time and geography, and then connected the fire/EMS data to the American Community Survey and social media,” says Shipp. “We provided the fire chief a corpus of data, as well as data insights about incidents by season, when special events occurred, and by neighborhood. The culmination of this work provided valuable insight to support local and future decision-making.”
Community Learning for Data-Driven Discovery: Modeling Success
Part of this successful partnership is based on a research model developed by Keller, Shipp, and the research division’s team—the Community Learning Through Data-Driven Discovery, or CLD3 for short.
Shipp explains the innovative approach. “At its core, CLD3 provides researchers with a guide and the philosophy that defines how we begin our work with a community. We don’t go into a community and say, ‘We want to study X.’ We approach them with, ‘What are your challenges? What keeps you up at night? What problems can’t you solve?’ But it doesn’t stop there. We continue to engage with community officials throughout the entire process. We brainstorm and identify data sources, context, and results. We work together as partners.
“Partnering is critical because we are not just handing them a report with the results that leaves them wondering, ‘Well, how do I use this?’ They’re involved at every step of the way. It’s incredibly rewarding.”
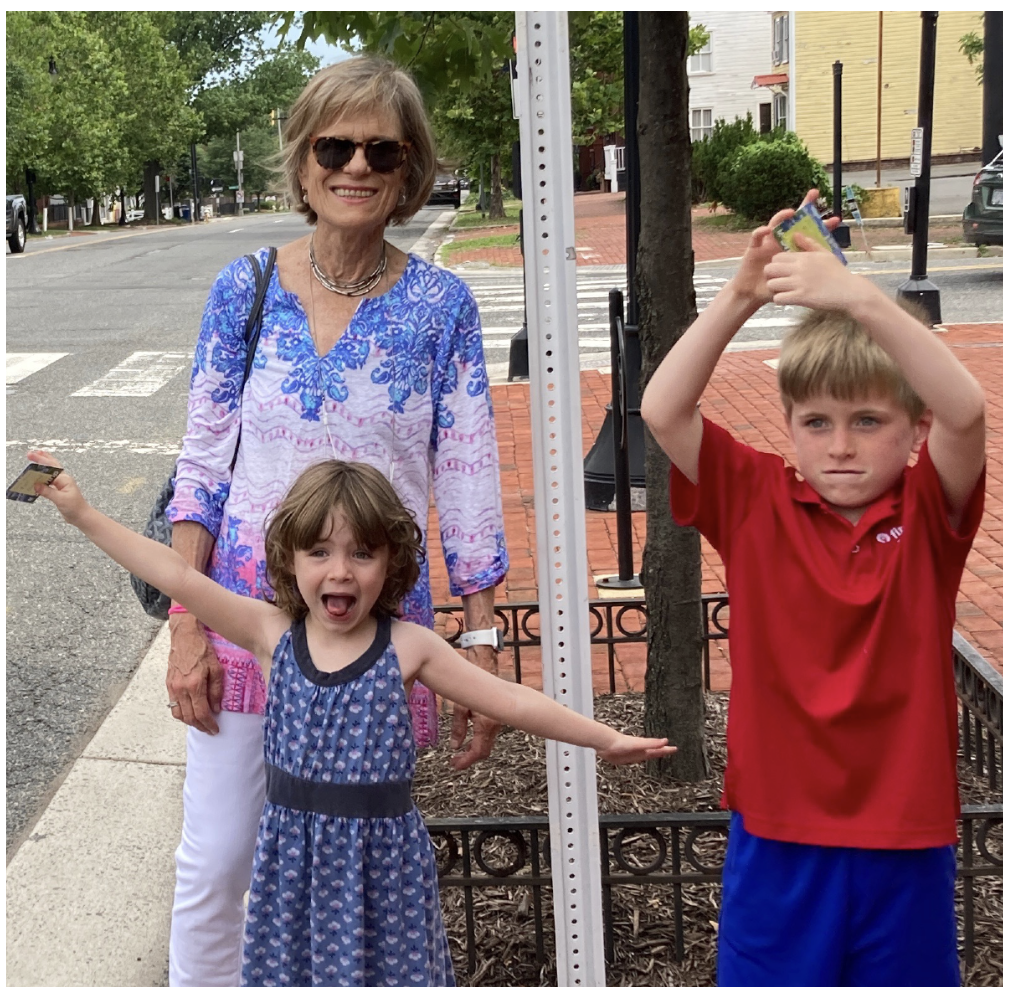
Stephanie Shipp heads to the National Gallery of Art via Metro bus and train with her grandkids, Myrna, age 5, and Francis, age 7.
Scaling the Mission
The Social and Decision Analytics team’s vision is to scale the CLD3 process nationally. They developed a strategy to bring the CLD3 process to local governments everywhere by leveraging the expertise of land-grant universities that disseminate information to communities and rural areas. The plan capitalizes on the expertise of the Cooperative Extension System. “Extension has been around for over 100 years and is the boots on the ground—they know their communities well,” Shipp explains.
In 2020, a three-state team received funding from the US Department of Agriculture and Bill and Melinda Gates Foundation to conduct a pilot to test their strategy across three states: Iowa, Virginia, and Oregon. They focused on advancing economic mobility by working with extension professionals on data-driven projects in their communities.
One project in Virginia was to look at access to health care when the community’s only hospital closed. The team received additional funding to extend this work across all counties in Virginia. Leaders in another community wanted to know how to successfully transition people who’ve been in jail back into society.
In Iowa, a CLD3 team identified communities in greatest need of excessive alcohol prevention resources. Another team expanded and enhanced the Iowa State University Extension Community Helpline services across the state by developing data science tools to capture customer service, monitor success, and auto-generate reports. This allowed helpline workers to spend more time working with residents and less time filling out paperwork.
In Oregon, one of the CLD3 teams examined the impact of regulations on economic development in eastern Oregon. Another team created an economic mobility baseline for the South County Wasco area.
The Tip of the Iceberg
Currently, the Social and Decision Analytics team is partnering with Mastercard’s Center for Inclusive Growth to build a social impact data commons for the Washington, DC, metropolitan area. They are working with local governments in the region to create the data commons, a knowledge repository designed to answer questions that matter most to community leaders.
“We’re talking with local government leaders and policymakers who are extremely interested in equity. For example, does everyone in their community have equitable broadband access, and can they afford it? Do they have equitable access to food that meets their cultural needs?” explains Shipp.
They are also collaborating with the Virginia Department of Health, which publishes a large amount of data. The department would like their data to be more easily accessible to increase understanding of their metrics, initially their rural health priority metrics. The data commons is a tool various audiences can use to explore data insights in their regions, communities, or neighborhoods.
“We’re taking their data, adding to it, and presenting it in new and interesting ways to help leaders answer questions that keep them up at night,” says Shipp. “We are developing these data commons to be replicable by other metropolitan areas and states to set the stage to begin scaling our work nationally. We’ve only seen the tip of the iceberg.”


 (No Ratings Yet)


