JSM Session Touches on Equity
Brian Tarran is head of the data science platform at the Royal Statistical Society and editor of Real World Data Science. He was previously the editor of Significance magazine.
Filter bubbles. Echo chambers. Groupthink. All things we are told to watch out for, steer clear of, or break out from. Nowadays, though, we hear less about the dangers of ‘vicious circles’—yet the dangers have not receded.

Sunghee Lee, University of Michigan
Lee’s work was presented in the session “Statistically Significant: Equity Concerns in Algorithmic Bias, Privacy, and Survey Representation.” The research done by Lee and presented by her University of Michigan colleague Raphael Nishimura compared the socio-demographics of Asian-American respondents reported by four large-scale sample surveys against the same characteristics collected by the US Census Bureau’s American Community Survey.
What Lee found was that the surveys often differed in important respects. For example, Asian Americans accounted for seven percent of adults aged 18 and over in the ACS, but in the General Social Survey (GSS) and Behavioral Risk Factor Surveillance Survey (BRFSS), they accounted for only four percent and two percent, respectively. And while 27 percent of Asian-American respondents to the ACS were educated to high-school level or below, the equivalent grouping in the BRFSS accounted for 18 percent.
More concerning was that none of the surveys, except the ACS, collected data on Asian Americans’ proficiency with spoken English. According to the ACS, 31 percent of Asian-American adults have “limited English proficiency,” yet Lee found that none of her four selected surveys (GSS and BRFSS, plus the Current Population Survey and National Health Interview Survey) offered questionnaires in Asian languages.
In summary, Lee found the geographic and ethnic heterogeneity of the Asian American population is not reflected in the data-collection efforts she focused on and current data likely over-represents Asian Americans who are born in the US and/or who have high levels of English proficiency. It is this underrepresentation of certain Asian-American subgroups that gives rise to a potential vicious circle—data is not collected, so issues affecting certain population groups are not identified, meaning no action needs to be taken, so no data is collected … and so on.
Data Equity in Data Privacy

Claire McKay Bowen, Urban Institute
As Bowen explained, there exists a natural tension between privacy and utility. A data set kept private and never released to the public has low (or no) utility, for example, whereas any data set released to the public inevitably sacrifices some privacy for the sake of utility. The question is, where to strike the balance between privacy loss and utility? To explore this, privacy researchers use what are called privacy-utility curves to visualize the trade-off for different data sets and subsets of the data. Inevitably, different groups can have different privacy loss and utility curves, said Bowen. What this means in practice, as explained in the report, is that “Some groups may need to sacrifice relatively higher levels of privacy loss for the same increase in statistical utility, which means that those groups may obtain higher utility and lower privacy loss relative to other groups.”
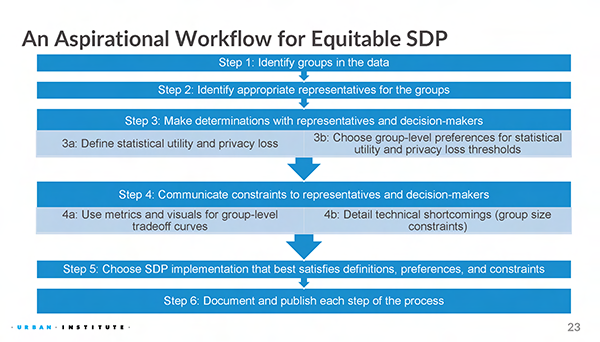
Claire McKay Bowen presented an “aspirational workflow” for creating equitable statistical data privacy during the session “Statistically Significant: Equity Concerns in Algorithmic Bias, Privacy, and Survey Representation” at JSM 2023 in Toronto, Canada.
Bowen also explored issues around defining groups in the data and identifying those who might best represent the interests of said groups, questions of resource allocation (how to provide access to restricted data and how to train people to properly use data), and the importance of not treating equity and privacy as separate studies.
Particularly useful was Bowen’s presentation of an ‘aspirational workflow’ for creating equitable statistical data privacy. Discussant Susan Gregurick of the National Institutes of Health praised the workflow for its focus on co-design and giving people a voice in the work being done to make sure they are benefiting from it.
Valid Decisions?

Amanda Coston, Microsoft Research
Coston began by defining validity, in the scientific or statistical sense, as the measures we use to actually measure what we intend to measure. For decision-making algorithms, she said, validity means the model predicts what it is supposed to predict. But, of course, they don’t always.
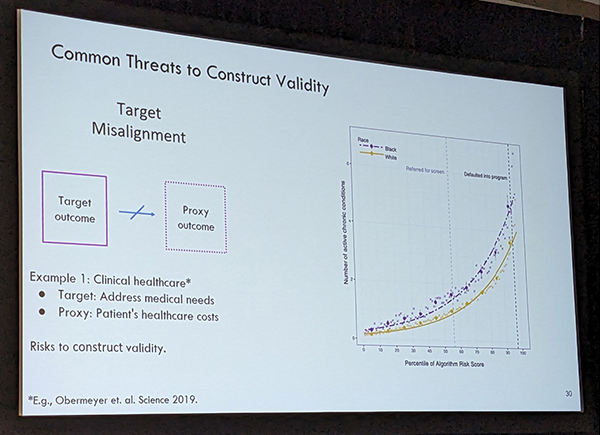
Amanda Coston concludes her talk with discussion of statistical methods that can be used to counteract threats to validity. Photo courtesy of Brian Tarran
She then gave examples of where validity can be undermined. For instance, in a health care context, an algorithm may be used to inform decisions on patient care. The aim may be to predict health care needs and select the most in-need patients for a treatment program based on algorithmic risk score. However, what if the designers of the algorithm use health care costs as a proxy for health care needs? This creates a risk to “construct validity,” said Coston. Drawing on work by Ziad Obermeyer and colleagues in their Science article titled “Dissecting Racial Bias in an Algorithm Used to Manage the Health of Populations,” she showed how, at the same risk score, the disease burden on Black patients was more severe than that of white patients, leading to what Obermeyer describes as “substantial disparities in program screening.”


 (No Ratings Yet)


Leave your response!