Large-Scale Data Inference Symposium Asks ‘Can We Believe What We See?’
Poster prize winner Shiling Ruan from FDA
The second Carl Morris Honorary Symposium on Large-Scale Data Inference took place on October 18, 2012. The symposium—organized by Social & Scientific Systems—explored the intersection of statistics and data visualization and centered on the question, “Can we believe what we see?”
Carl Morris opened the symposium with a talk about regression toward the mean and the use of multilevel models and shrinkage estimation to reduce the number of false positives. He presented examples of instances in which regression toward the mean is expected and demonstrated how empirical Bayes methods can produce better point estimates with tight confidence intervals.
Mark Hansen followed with a talk that showcased the use of data exploration as a source of inspiration. He presented various artistic methods for displaying, rather than summarizing, data, including an installation in the lobby of The New York Times building, a display of Shakespeare quotes in the lobby of the Public Theater in New York, animations of the propagation of tweets and flights, and a creative display of eBay purchases.
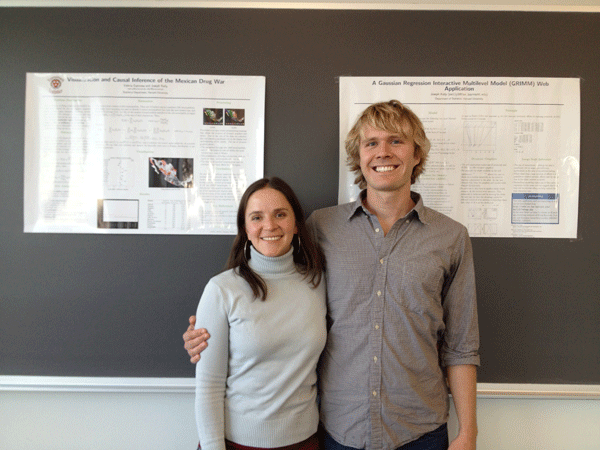
Poster prize winners Joseph Kelly and Valerie Espinosa from Harvard University (not pictured: Patrick Foley from Carnegie Mellon University)
Diane Cook presented innovative work on creating an inferential framework for graphical displays by treating them as test statistics and using test protocols based on permutations to assess their power and type I error rates. Cook presented two such protocols, one modeled after the Rorschach test and one after the police lineup in a criminal investigation, illustrating the latter with examples and discussing an R package (nullabor) that encapsulates these approaches.
Rob Kass discussed the difficulties of analyzing data from experiments in neurophysiology, focusing on modeling spike trains. He discussed extensions of Poisson process models to examine synchronous and asynchronous firing patterns among groups of neurons and used this application to stress the importance of statistical thinking (e.g., using probabilistic models to describe variation).
Chris Volinsky described ingenious uses of mobile phone connection information to answer a variety of questions about mobile phone voice versus text use, commuting patterns, and, more generally, questions that allow city planners to explore their city. Volinsky discussed the delicate balance between confidentiality and analysis and demonstrated how minimally invasive approaches can yield valuable information.
The concluding panel discussion explored a range of topics, including the changing role of statistics and visualization, the tension between mathematical approaches versus ad hoc computational approaches, the wide range of definitions for Big Data, and the set of computational skills statisticians are now expected to have.


 (No Ratings Yet)


