Gender Balance in ASA Activities Update
Bonnie Ghosh-Dastidar, Anagha Tolpadi, and Dalene Stangl
EARLIER COWIS REPORTS: 2010 Report, 2012 Report
This article continues the tradition of looking at the representation of ASA women members among a range of activities supported by the American Statistical Association (ASA), using more recent data from September 2015. This report is being written on behalf of the Committee on Women in Statistics (COWIS). The primary objective was to indicate areas where gender disparities have subsided, as well as highlight those areas where they persist.
While our findings suggest the representation of women across ASA activities has generally improved between 2012 and now, the share of women serving on the editorial boards of scientific journals should be higher (an area that was not previously explored). We also observed that ASA sections in which women are a larger share of the section membership are not well represented in the ASA awards structure. For example, offering awards for doing statistics in the life and/or social sciences substantive areas may improve the gender balance across awards given by the ASA.
Women are an increasing share of the ASA, and considering issues of career development and advancement is an important topic for all. Future efforts should also look at the participation of women members in continuing education efforts and consider issues and metrics relevant especially to women in industry.
Overall Membership
The ASA database contained records for 18,944 members in September 2015. Only members with a reported value of gender were included in this analysis. Of the 18,944, 12.7% did not report a value, while another 2.1% responded as “don’t know/don’t wish to answer.” Therefore, our sample size is 16,135, or 85.2%, of the current membership.
Age: The ASA membership is made up of 34.6% women and 65.4% men. Compared to prior years of data when the percentage of women was 32% in 2012 and 31.5% in 2010, we see a slight upward trend in the share of women in the ASA membership. Women in the ASA are, on average, younger than men—with an average age of 42 years for women compared to 49 years for men. Among ASA members who are less than 45 years of age (n=7,405), 42.9% are women; among members 45 years of age or older (n=7,683), 24.7% are women.
When we looked at the age breakdown among men and women, we found that among ASA men (n=10,017), 57.8% are ages 45 years or above while among women (n=5,071), 37.4% are ages 45 years or above. These percentages are lower than those in 2010 when 66% of men and 41% of women ASA members were ages 45 years or above. This suggests that the ASA membership is getting younger with a decreasing share of those 45 years of age or older, and that the representation of women in the overall ASA membership should continue to increase.
Education level: For this analysis, we restricted the sample further to those who reported their highest degree (n=15,769). Among all ASA members who reported a value for highest degree, 56.6% and 32.4% have a doctoral and master’s degree, respectively (similar to 2010 and 2012). Among women, the breakdown is a little different, with a lower percentage (48.8%) reporting a doctorate as their highest degree and a higher percentage (39.0%) reporting a master’s. Women appear to be less likely to have a PhD and more likely to have a master’s degree, compared to the overall membership.
Conversely, 29.6% of ASA members with a PhD degree (n=8,615) and 41.2% of ASA members with a master’s degree (n=4,944) are women. The percent of women among PhD degrees awarded in 2013 for the fields of “Statistics” and “Biometrics and Biostatistics” is 41.7 (212 out of 509). (Statistic comes from the latest “Survey of Earned Doctorates” (NSF/NIH/USED/NEH).)
Subdivided, there are 47.3% women doctoral recipients (69 out of 145) in biometrics and biostatistics and 39.3% women doctoral recipients (143 out of 364) in statistics. Similarly, we looked up the share of women among recent master’s degrees and found 48.5% out of a total of 2,819 earned master’s degrees were awarded to women in 2012. (Latest available statistic from the Digest of Education Statistics from the National Center for Education Statistics, which reported the total number of earned master’s in 2012–2013.)
Again, the total number of earned master’s degrees combines multiple fields. (Fields include “Biometry/Biometrics,” “ Biostatistics,” “Statistics, general,” “Mathematical statistics and probability,” “Mathematics and statistics,” “Statistics, other,” and “Mathematics and statistics, other.”)
While the ASA percentages (29.6% and 41.2%, respectively) are lower than the percentages of women among recent PhD and master’s graduates (41.7% and 48.5%, respectively), it is important to note that the ASA statistics are for graduates across many decades, while the surveys report on most recent graduates. The lower estimates of ASA relative to the surveys are likely explained by an increasing share of women among recent graduates in statistics.
It seems like the survey statistics should be more directly comparable to the breakdown by gender among younger ASA members (or recent graduates). Therefore, we computed the percentage of women among younger ASA members because we do not have information to identify recent graduates (year of graduation was not available in the ASA database). When we restricted the ASA members to those born in 1985 or later with a non-missing value for highest degree (n=2,655), we found that 43.1% of PhDs and 52.6% of master’s degree holders are women. Thus, we found that the share of women among younger ASA members (ages 30 years or less) is comparable to the statistics reported by recent waves of the SED and NCES, and even slightly higher. These statistics demonstrate that the demographic composition of the ASA is changing with an increasing share of women. The slightly higher estimate in the ASA may actually indicate that there is a growing presence of women in the ASA relative to the field.
To look at the representation of women across age group and highest degree more finely, we computed the percentage of women among ASA members in each of these sub-groups defined by age (< 45, >= 45) and highest degree (PhD, Master’s, Associate or Bachelor’s). The percentage of women among ASA members with ages < 45 and with a doctoral degree is 42.0%, which is similar to the percentage (41%) of women among PhD recipients between 1997‐2006 (See Table 1).
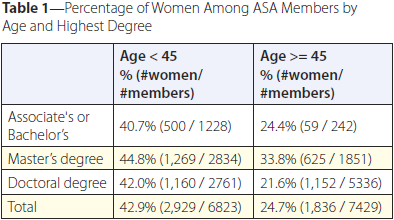
Table 1—Percentage of Women Among ASA Members by Age and Highest Degree
Place of employment: Among ASA members, 32.0% of academics (excluding students) (n=5,886), 32.5% of business and industry employees (n=4,139), and 35.0% of federal government employees (n=1,098) are women. The lowest percentage of women (24%) is found among the “self‐employed/private consultant” category (n=641), while the highest percentage of women (40.5%) is found in the “other” category (n=1,657). Other is a mix of people who don’t think the specific categories define their role, including individuals at research institutions and medical centers. Compared to 2010, we find an increase of 4.6% and 4.1% in the share of women in academics and business/industry, respectively.
ASA Section Membership
About a third of ASA members (33.7%) belong to one or more sections of the ASA, which is similar to the rate among ASA women (33.3%). Some indication of interest areas for women ASA members can be learned from the representation of women across these sections. Thus, Table 2 indicates the percentages who are women in each section together with the total number of members belonging to the section. The ranking of sections in the order of percentage of women is similar to that of 2010.

Table 2—Percentage of Women and Total Number of Section Members
ASA Service and Scientific Activities
Women participate across the different levels of the ASA organizational leadership. In 2015, the ASA executive committee consisted of 17% women (1 out of 6), and the ASA Board of Directors had 44% women (7 out of 16). The 2016 Board of Directors has 56% women (9 out of 16), and the president of ASA is female. Relative to their share of the membership, women in the ASA have less representation in publication activities. The Committee on Publications has about 29% women (7 out of 24). The ASA’s flagship journal, JASA, has 25% (25 out of 101) women on the editorial board (including editors and associate editors) for Theory and Methods, 15% (6 out of 40) for Application and Case Studies, and 30% (6 out of 20) for Reviews. In August 2010, these percentages were 18%, 21%, and 33%, respectively.
Table 3 shows the number and percentage of women on the editorial boards of several statistics journals. We include the total number, which includes editors, associate editors, reviews editors, editor-elects, assistant editors, and advisory editors, and the percentage of women on the board. While there may be considerable variation in editorial boards from year to year, one might expect these percentages to be close to the percentage of women among members with a doctoral degree (29.6%). Only three ASA journals meet or exceed this expected value of 29.6%, including Journal of Educational and Behavioral Statistics; Journal of Agricultural, Biological, and Environmental Statistics; and JASA Reviews.
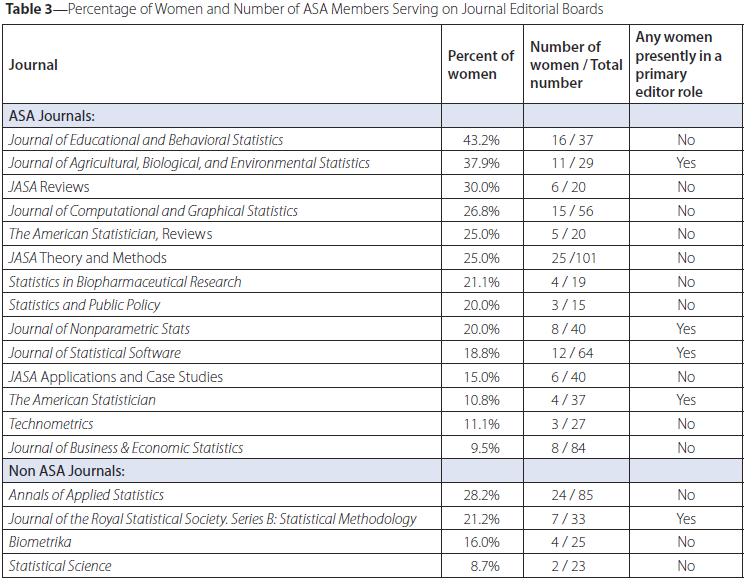
Table 3 (click to enlarge)—Percentage of Women and Number of ASA Members Serving on Journal Editorial Boards
Another measure of ASA activity is participation in JSM. In 2015, 40% of the members of the program committee (8 out of 40) were women. Only 2 of 11 of the keynote speakers listed in the 2015 program were women. Another indicator of both professional regard and involvement is giving an invited talk or chairing an invited session. Counting women chairs, presenters, panelists, and discussants in all invited panels, papers, and special presentations on the Monday of JSM 2015 (for illustration only) yields about 33.8% women (67 out of 198), indicating a participation that corresponds well with overall membership percent. (These counts include one invited panel, where 4 out of 4 panelists were women.)
ASA Fellow Selection
Of all ASA members, 8.4% are fellows, while among women, 5.1% are fellows. Of the 1,434 ASA fellows in the current ASA membership database, the great majority, or 89.8% (n=1,288), hold a doctoral degree. In addition, there are 59 ASA fellows with a bachelor’s, master’s, or other degree and another 87 who did not list their degree. When the membership is subset to doctoral degree holders, 16.6% of men (n=6,035) and 10.0% of women (n=2,550) are fellows. When doctoral degree holders were further separated by age, we found that 1.9% of men and 1.9% of women were fellows among those 45 years or younger, while 22.3% of men and 17.9% of women were fellows among those 45 years or older.
COWIS has long tracked the percentage of nominations and selections of women as ASA fellows. The two graphs in Figure 1 present these results since 2004. Importantly, the years with high percentages of women among total nominations were those when ASA leadership or COWIS members exerted special effort to nominate women. In the years between 2005 and 2009, the percentage slipped as efforts waned.
The second panel demonstrates that women, once nominated, had similar or slightly higher rate of success.

Figure 1. Percentage of nominations and success rates among women for ASA fellowships
Table 4 shows the percentage of men and women who are fellows among members with doctorate degrees, by five-year age groups above 45. It is interesting that the percentage of women fellows in the youngest group (45–49 years of age) is higher (10.6%) than the corresponding statistic for men (8.8%). This is likely due to ASA-wide efforts to increase the visibility of women within the association.
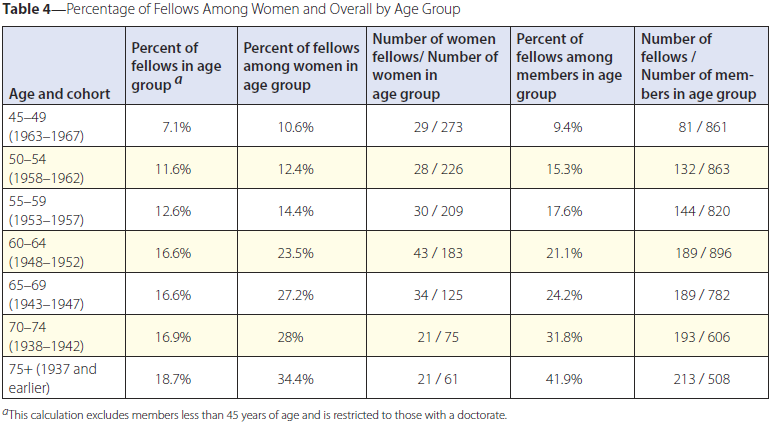
Table 4 (click to enlarge)—Percentage of Fellows Among Women and Overall by Age Group
ASA Awards
The ASA grants several prestigious awards as recognition of professional excellence, apart from the ASA fellowship. Gender data on awardees from a number of societies, including the ASA, were collected by the AWIS AWARDS project in collaboration with ASA staff.
ASA awards and percentages of awardees who were women are reproduced in Table 5. We see that the percentage of women among recipients of ASA awards is quite low and has not increased since the last decade. The numbers also reflect a general finding of the AWIS study that women are more likely to receive awards recognizing service than scientific achievement. It was noted by the study that ASA awards council members are presently 29.4% women.
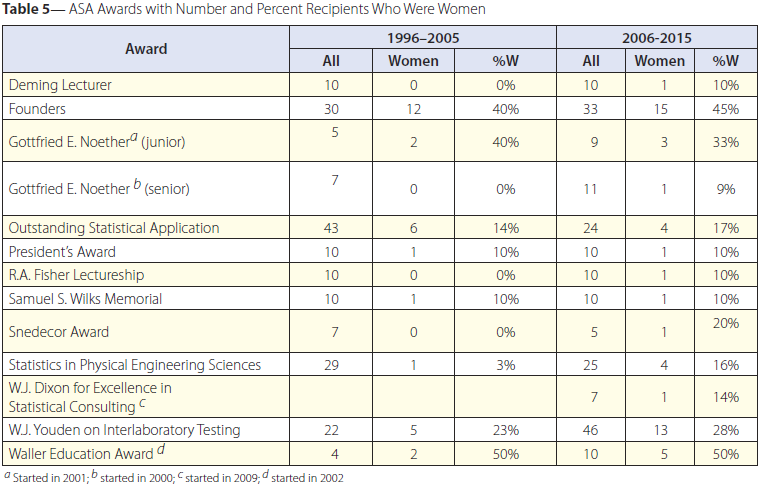
Table 5 (click to enlarge)—ASA Awards with Number and Percent Recipients Who Were Women
Extensive research on implicit stereotyping cited in the AWIS AWARD workshop does indicate that just including women on award selection committees is necessary, but not sufficient, to ensure unbiased consideration, free of subconscious gender expectations. Perhaps even more importantly, comparing the list of awards to the list of sections indicates that predominant present interest areas of both men and women in the ASA, such as biometrics and social statistics, are not well captured by awards.


 (No Ratings Yet)


https://lovestats.wordpress.com/2016/02/16/the-gender-split-in-mrx-conferences-2016/