Women in Science Still Overlooked
Mari Palta, Committee on Women in Statistics Chair
This report summarizes a variety of ways women are involved in activities related to the ASA. Some of the statistics presented point to areas in which there should be concerted efforts to involve more women. Others could inform plans to hone ASA activities so they appeal to the current mix of members.
Overall Membership
The ASA database contains records for 14,650 members. Of these, 160 declined to report their gender. Among the 14,486 remaining, 4,611 (31.5%) are women. This compares to just below 30% in 2005 and 33.5% in 2008. Hence, the percentage does not seem to have increased much in the last five years. According to the 2006 Survey of Earned Doctorates, the percentage of women among those earning PhDs in statistics/biostatistics from 1997–2006 was 41%.
The percentage of members who are women differs considerably by age and highest degree status. Women members tend to be younger and are less likely to hold doctoral degrees. Overall, among 14,281 ASA members who reported degree status, 57.2% hold a doctoral degree and 32.5% hold a master’s degree as their highest degree. Among women, the corresponding percentages are 45.6% and 42.0%. Conversely, 41% of all members with a master’s degree are women and 25% of all members with a PhD degree are women.
Among men, 66% of ASA members are age 45 years or above, while only 41% of women are. Overall, these percentages indicate slight aging of the membership since 2008, as then 54% of all members were 45 or above and almost 59% are now. Table 1 shows the percentage of women in different age and degree categories.
Table 1—Percentage of ASA Members Who Are Women Within Degree and Age Categories
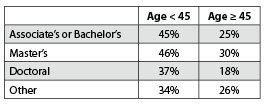
The percentage of women among ASA members age < 45 with doctoral degrees at (37%) is slightly lower than the percentage (41%) of women among PhD recipients from 1997–2006.
The percentages of women vary slightly by place of employment. Of members employed in academia, 27% are women; in business and industry, 29% are women; and in federal government, 33% are women. The lowest percentage of women (24%) is found among those who are self-employed, and the highest (41%) is among retired members. While there are no data on percent of women in leadership positions in government and industry, 15 of 94 chairs of PhD-granting statistics and biostatistics departments are women, according to data collected by ASA Research and Graduate Education Manager Keith Crank. At 16%, this is slightly below the 18% of women among ASA members age 45 and older with doctoral degrees.
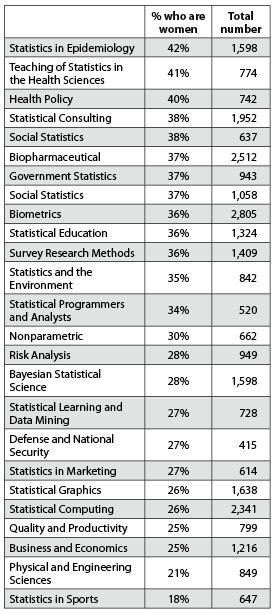
Some indication of women’s interest areas can be gleaned from membership in ASA sections. Table 2 shows the percentages of women in each section together with the total number of members belonging to the section. There is a tendency for the percentage of women to be higher in sections with more members.
Table 2—Total Number of Members in ASA Sections and Percent Who Are Women in Each Section
Participation in ASA Activities
Women are well represented in the ASA organizational leadership. Presently, one-third of the ASA executive committee is made up of women, and 45% of the ASA Board of Directors is made up of women. Based on the overall ASA membership composition, one may expect about 30% of women to be in leadership positions open to all ages and backgrounds, such as being on ASA committees.
Another indicator of ASA activity is participation in the Joint Statistical Meetings (JSM). In 2010, 38% of the members of the JSM Program Committee were women. Among registered participants, 56% were men, 32% were women, and 12% did not report gender (data provided by Steve Porzio, the ASA’s associate executive director and director of operations). If missingness is completely at random, this would indicate that 36% of JSM participants in 2010 were women.
Professional regard and involvement also is expressed by giving an invited talk or chairing an invited session. Counting women chairs and speakers in all invited sessions on August 2 yields about 30% women, indicating participation that corresponds well with overall membership percent.
On the other hand, not a single one of six keynote speakers listed in the 2010 JSM program is a woman. Also, women are noticeably absent as leaders of Continuing Education courses. Of 24 such courses listed in the program, only two had women as lead instructors. It appears this is a missed opportunity for women to establish themselves as experts in a specific statistical area.
Women are even less well represented in the leadership of ASA publications. The Committee on Publications includes four women, amounting to about 20%. The ASA website lists 12 journals as being published by the ASA, and these journals have 17 editors-in-chief. Only two (12%) are women. However, a woman was just announced as the new editor for the Journal of Agricultural, Biological, and Environmental Statistics, so change may be imminent.
The ASA’s flagship journal, Journal of the American Statistical Association (JASA), has three chief editorial positions and corresponding editorial boards: Theory and Methods, Applications and Case Studies, and Reviews. Presently, these boards are comprised of 18%, 21%, and 33% women, respectively. In December 2007, these percentages were 10%, 34%, and 17%, respectively. Both older and younger statisticians have the opportunity to participate on journal editorial boards, so the percentage of women in editorial roles could be expected to be close to the 25% of women among members with doctoral degrees.
There may be considerable variation in editorial boards from year to year, depending on the editors-in-chief. The current larger percentage of women among associate editors for Reviews reflects appointments by the female editor for this section of JASA. It is striking that since 1990, there have been only three women in any of the JASA editorial positions. From 1995–1997, both the editor for Applications and Case Studies (named coordinating editor at the time) and the editor for Reviews were women. At that time, 6.5% of the editorial board for Theory and Methods, 27% of the board for Applications, and 31% of the board for Reviews were women. Since then, the only woman editor has been the present editor for Reviews, although there has long existed a pool of women associate editors potentially qualified for the editor positions.
Fellow Selection
There has been much recent interest in how many women receive recognition through society awards. The Committee on Women in Statistics (COWIS) has long tracked the percentage of nominations and selections of women as ASA Fellows, and the Committee on Fellows has recently publicized these percentages. The graphs in Figure 1 present results since 1998. Importantly, the years with reasonable percentages of women among nominations were those in which the ASA leadership or COWIS members exerted special effort to nominate women. In the years between 2005 and 2009, the percentage slipped as efforts waned.

Figure 1. Percent of Fellow nominations for women and percent of success for women among those nominations since 1998
The second panel demonstrates that women, once nominated, had a similar or slightly higher rate of success. The 18% of women among members age 45 and older with a PhD may arguably be considered a benchmark for percent of women being elected Fellow.
The overall percentage of ASA members who are Fellows is 4.5% for women and 9.9% for men. Although 64 members with associate’s, bachelor’s, master’s, or other degrees are Fellows, the majority (1,096) of Fellows hold doctoral degrees. Among doctoral degree holders, 15% of men and 9% of women are Fellows. Among doctoral degree holders less than 45 years old, 1.8% are Fellows among both men and women. At age 45 and above, 21% of men and 16% of women are Fellows. Table 3 shows the percentage of men and women who are Fellows among members with doctoral degrees by five-year age groups above 45.
Table 3—Percentages of Women and Men Who Are Fellows Among Those with Doctoral Degree in Age Groups 45 Years and Older
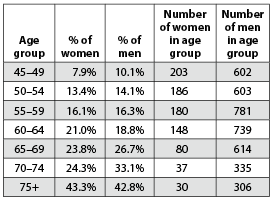
We see that percentages of Fellows are similar for women and men ages 50–65. It must be kept in mind, however, that data from older ages reflect not only the Fellow selection process, but also survival and the decision to remain an ASA member. Generally, although the rate of nomination of women for Fellow has approached the expected percentage in some years, the percentage of Fellows among senior women is still too low.
Other ASA Awards
The ASA grants several other prestigious awards. Gender data on awardees from a number of societies, including the ASA, were collected by the Association for Women in Science (AWIS) in collaboration with the ASA for the NSF-funded Advancing Ways of Awarding Recognition in Disciplinary Societies (AWARDS) project (see Awards for Women Fall Short). ASA awards and percentages of awardees who were women are reproduced in Table 4 (slightly corrected and updated from the AWIS report).
Table 4—ASA Awards with Number and Percent Recipients Who Were Women
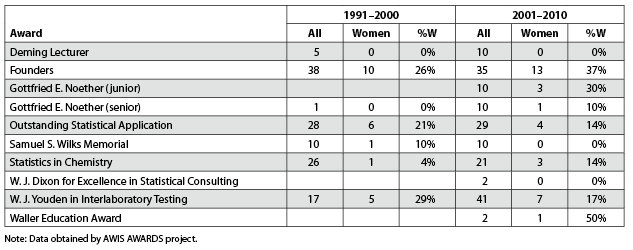
The percentage of women among recipients of ASA awards is low and has not increased in the last decade. Some awards have never been granted to a woman. The numbers also reflect a general finding of the AWIS study that women are more likely to receive awards recognizing service than scientific achievement.
It was noted in the AWIS study that ASA award committees are presently composed of 35% women. Extensive research on implicit stereotyping cited in the AWIS AWARDS workshop indicates that including women on award selection committees is necessary, though not sufficient, to ensure unbiased consideration that is free of subconscious gender expectations. Perhaps even more importantly, comparing the list of awards to the list of sections indicates that predominant interests of both men and women in the ASA, such as biometrics and social statistics, are not well captured by awards.
ASA sections also give a number of awards. At JSM 2010, 43 nonstudent awards were awarded by sections. Additional awards were based on recognition of continuing education course offerings (three awards) and excellence in statistical reporting (one award). Among these 47 nonstudent awards, 15 (32%) were given to women, representing the proportion of ASA members who are women well.
There were also 10 awards for service to chapters, of which four (40%) were given to women.
Finally, the ASA participates in prestigious awards given by the Committee of Presidents of Statistical Societies (COPSS). Recipients are chosen by six-member committees with representatives from COPSS, the ASA, the Institute for Mathematical Statistics, the Statistical Society of Canada, and the International Biometric Society – ENAR and WNAR.
The Presidents’ Award is granted to a young member of one of the societies in recognition of outstanding contributions to the profession and statistics. It has been given to one woman and nine men since 2001. In 2010, there were no women on the selection committee for the award.
The Fisher Lectureship, which recognizes the importance of statistical methods to scientific investigations, has not been given to a woman since 2001. The 2010 selection committee included two women.
The Elizabeth Scott Award is given to individuals who have made major contributions to further the careers of women in academia. In contrast to the other awards, and not unexpectedly, all but one of the Elizabeth Scott Award recipients since 1992 have been women. The committee for this award had five women in 2010, with the only male member being the committee chair.
COPSS awards not given out in 2010, as they are awarded in odd years, are the F. N. David Award, which by definition goes to a woman, and the Snedecor Award. The latter recognizes a noteworthy publication in biometry. Since 1990, there have been 16 recipients of the Snedecor Award, two of whom were women.
Summary
There is a large percentage of women in the ASA, especially among younger members. Women members more often belong to sections interested in biological and social science applications. Women are well represented among the ASA’s organizational leadership, but not on editorial boards or as recipients of prestigious awards. Nominations of women for Fellow, and likely for other awards, depends heavily on special effort by ASA members and leadership. There appears to be a large untapped pool of women for editorial service on ASA journals.


 (No Ratings Yet)
You forgot to mention the Florence Nightengale award that is directed to female statisticians and thus has 100% female recipients. It is given on alternate years from the Elizabeth Scott award and is given to a female statistician. The criteria for the award are excellence as a role model for women; excellence in statistical research; leadership of multidisciplinary collaborative groups; statistics education; and service to the profession. The award was established in 2001 and is sponsored jointly by COPSS and the Caucus for Women in Statistics.
Dianne,
I know I could/should have said more about the FN David award–I especially regret not mentioning the Caucus– but the award is referred to in the article. In the last paragraph it says:
COPSS awards not given out in 2010, as they are awarded in odd years, are the F. N. David Award, which by definition goes to a woman, and the Snedecor Award. The latter recognizes a noteworthy publication in biometry. Since 1990, there have been 16 recipients of the Snedecor Award, two of whom were women.
By the time I got to this part, I was fatigued and also afraid article was getting too long (as I think it indeed was!)Also, the tilt was mostly that women miss out on awards that usually go to men.
Mari
Welcome!
Amstat News is the monthly membership magazine of the American Statistical Association, bringing you news and notices of the ASA, its chapters, its sections, and its members. Other departments in the magazine include announcements and news of upcoming meetings, continuing education courses, and statistics awards.
ASA HOME
Departments
Archives
ADVERTISERS
PROFESSIONAL OPPORTUNITIES
FDA
US Census Bureau
Software
STATA
QUOTABLE
“ My ASA friendships and partnerships are some of my most treasured, especially because the ASA has enabled me to work across many institutional boundaries and
with colleagues from many types of organizations.”
— Mark Daniel Ward
Editorial Staff
Managing Editor
Megan Murphy
Graphic Designers / Production Coordinators
Olivia Brown
Meg Ruyle
Communications Strategist
Val Nirala
Advertising Manager
Christina Bonner
Contributing Staff Members
Kim Gilliam