

Steve Pierson, ASA Director of Science Policy
Download a PDF of all the tables in this article.
This summer’s release of the 2025 degree completion data from the National Center for Education Statistics shows the awarding of statistics and biostatistics degrees holding steady and continued strong growth for data science and analytics degrees.
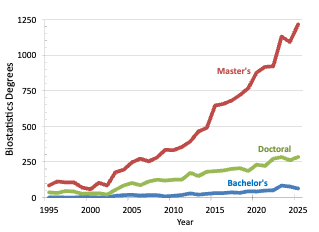
For statistics and biostatistics, master’s degrees in biostatistics and bachelor’s degrees in statistics showed modest growth, as shown in Figures 1 and 2. Other statistics and biostatistics degrees generally held steady. Meanwhile, degrees for the relatively new categories of data science and data analytics continue to skyrocket, as seen in Figures 2 and 3.
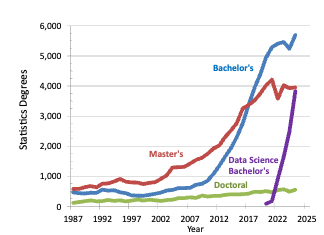
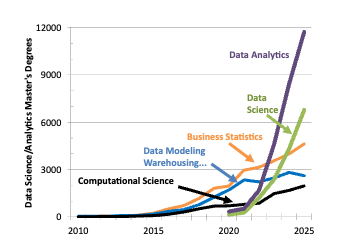
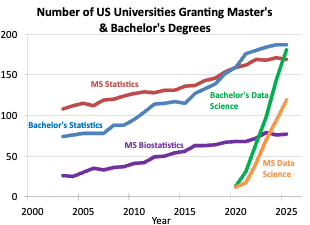
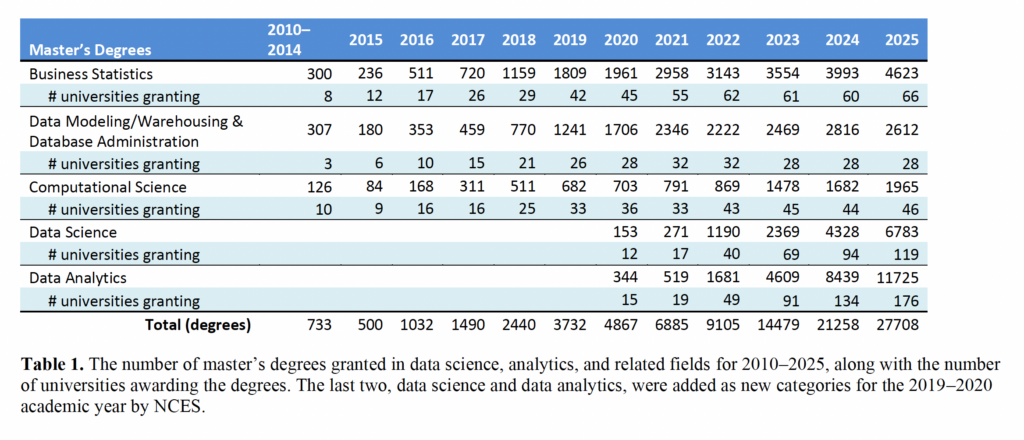
For degrees in data science and analytics, NCES introduced two Classification of Instructional Programs codes starting with the 2019–2020 academic year: CIP code 30.70 for data science and 30.71 for data analytics. The growth in these degrees at the bachelor’s and master’s levels is dramatic: Bachelor’s degrees in data science increased 54% to 3,827, as shown in Figure 2, and data analytics bachelor’s degrees increased 30% to 2,947. Data science master’s degrees grew 57% to 6,783 and data analytics master’s increased 39% to 11,725, as shown in Figure 3. The number of universities awarding those degrees also continued strong growth, as shown in Figure 4 and Table 1.
Prior to the introduction of the data science and analytics CIP codes, the ASA used three other CIP codes as proxies to track the growth of such master’s programs: business statistics; data modeling/warehousing and database administration; and computational science. As seen in Figure 4, business statistics and computational science master’s degrees continued to grow while data modeling/warehousing and database administration declined slightly from 2024 to 2025. As shown in Table 1, the number of universities awarding master’s degrees in business statistics increased to 66 from its previous high of 62, while the other two degrees within these three CIP codes were relatively flat.
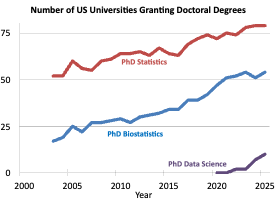
Figures 4 and 5 also show the number of universities awarding bachelor’s, master’s, and doctoral degrees in statistics and biostatistics has leveled off in recent years. Eight universities granted a total of 63 biostatistics degrees at the bachelor’s level in 2025, with The University of North Carolina granting 43 of them.
The following 31 universities granted statistics and biostatistics degrees for the first time (at least since 2003) in 2024 or 2025:
- Bachelor’s degrees in statistics (15): Augustana University, Bennington College, College of Charleston, Grove City College, Haverford College, Indiana University-East, Jackson State University, Loyola Marymount University, Middlebury College, Muhlenberg College, San Jose State University, Syracuse University, University of Cincinnati, University of Massachusetts-Dartmouth, Whitman College
- Bachelor’s degrees in biostatistics (1): Bennington College
- Master’s degrees in statistics (6): California Polytechnic State University, Cleveland State University, Emory University, University of Oklahoma-Norman, The University of Texas at Arlington, University of North Dakota
- Master’s degrees in biostatistics (6): Kent State University, University of Illinois Chicago, University of Kentucky, The University of Tennessee Health Science Center, The University of Texas Medical Branch at Galveston, Weill Medical College of Cornell University
- PhD in statistics (1): The University of Texas at El Paso
- PhD in biostatistics (2): Claremont Graduate University; University of Illinois Chicago
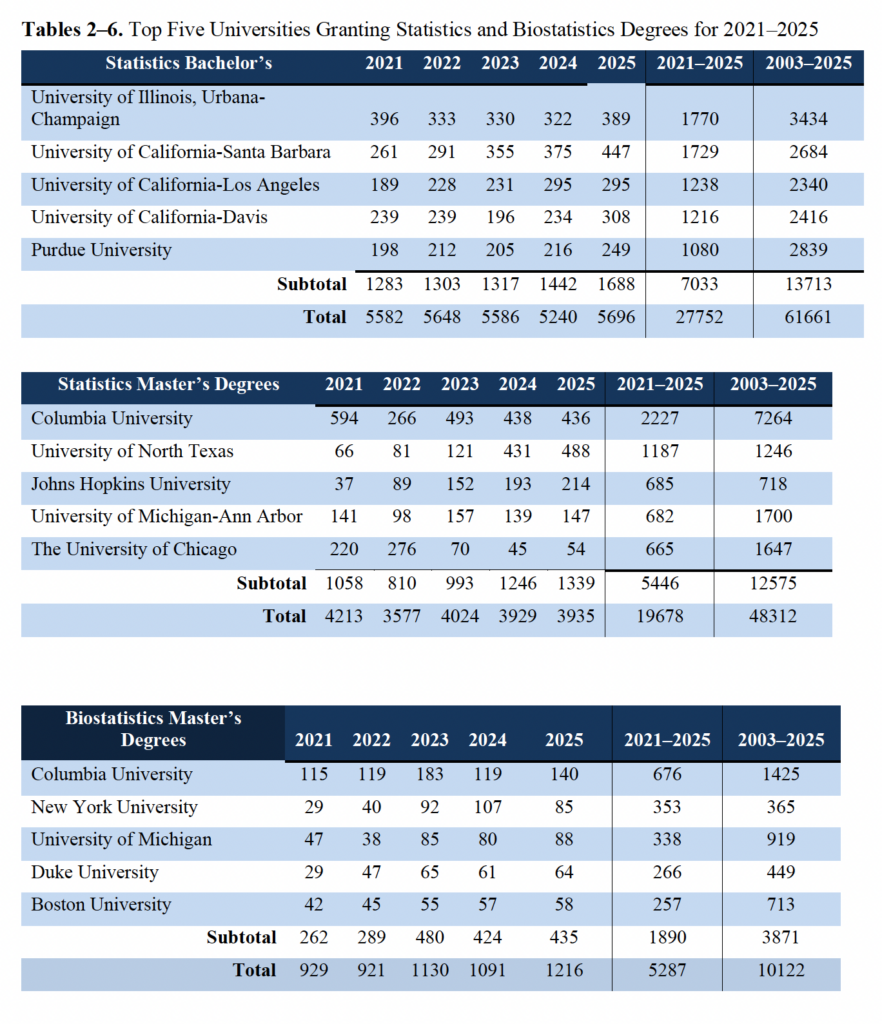
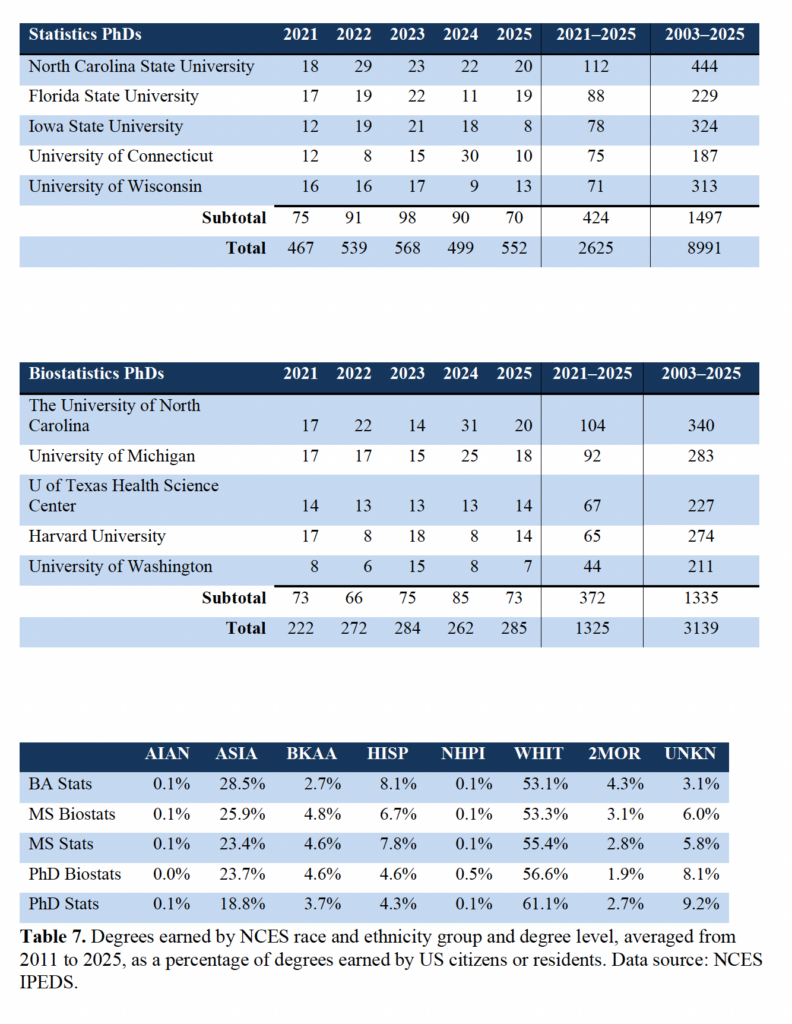
The top degree-granting institutions over the last five years are in Tables 2–6 for all categories except biostatistics bachelor’s degrees.
View these and related data—including the universities awarding master’s degrees in business statistics.
Demographics
In this final section, we look at the breakdown of degrees for race and ethnicity data, non-resident aliens and US citizens or residents, and the percentage of statistics and biostatistics degrees earned by gender.
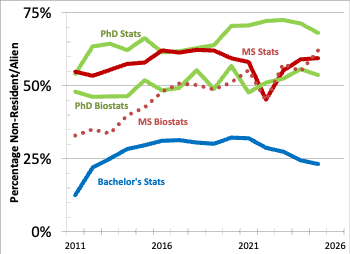
As shown in Figure 6, the percentage of master’s and doctoral degrees in statistics awarded in 2025 to non-resident aliens is near 60% and 68%, respectively. For the same degree levels in biostatistics, it is roughly in the range of 55–60%. The percentage for bachelor’s degrees in statistics has ticked down several percentage points in recent years to below 25%.
The NCES has race and ethnicity data for degrees granted to US citizens or residents, but does not have such data for nonresident aliens. Table 7 shows the race and ethnicity breakdown of US citizens and residents averaged for 2011–2023. For the five degrees—not including biostatistics bachelor’s for which the numbers are small—the percentage of degrees earned by those who report their race as American Indian or Alaska Native is essentially 0%. For those identifying as Asian, the range is 18–27%. It is 3–5% for those identifying as Black or African American. The percentage for individuals of Native Hawaiian or Other Pacific Islander descent is 0–1%. The percentage for those individuals who identify as white is 55–62% and, for individuals who report two or more races, it is 1–4%. For those identifying ethnicity as Hispanic or Latino, the percentage is 4–8%. Finally, the percentage for those reporting race/ethnicity unknown is 3–9%.
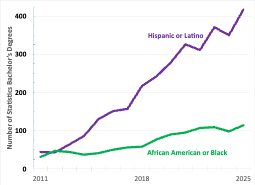
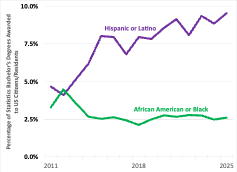
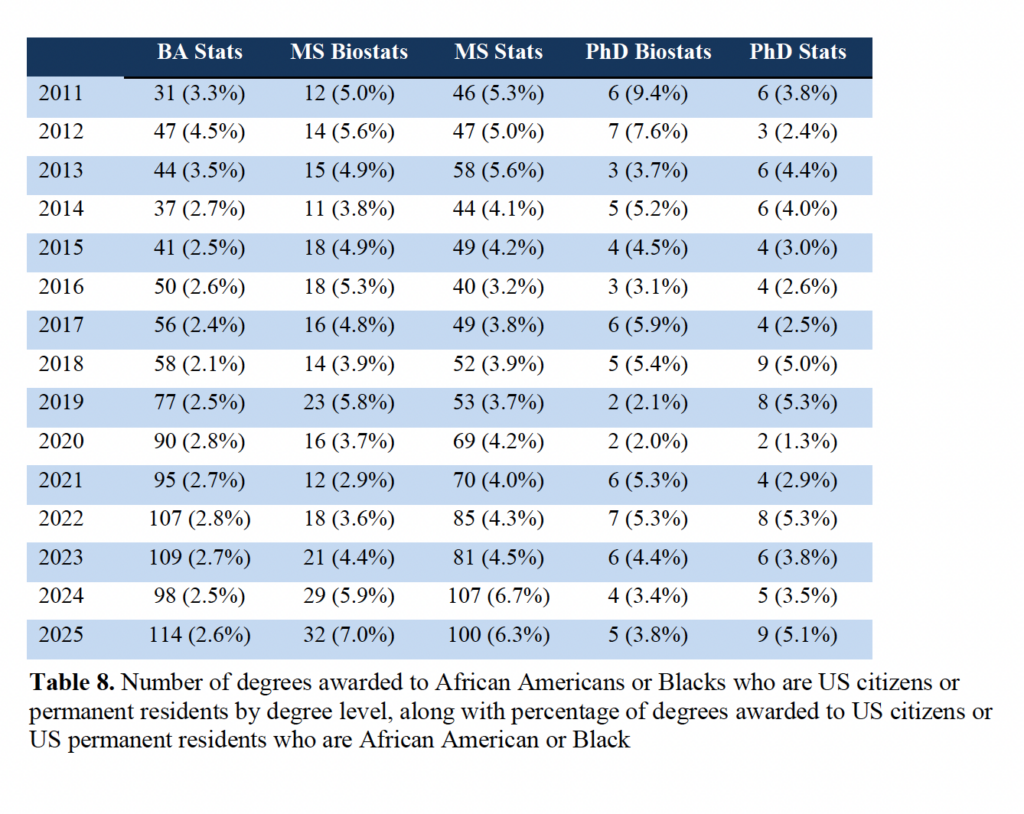
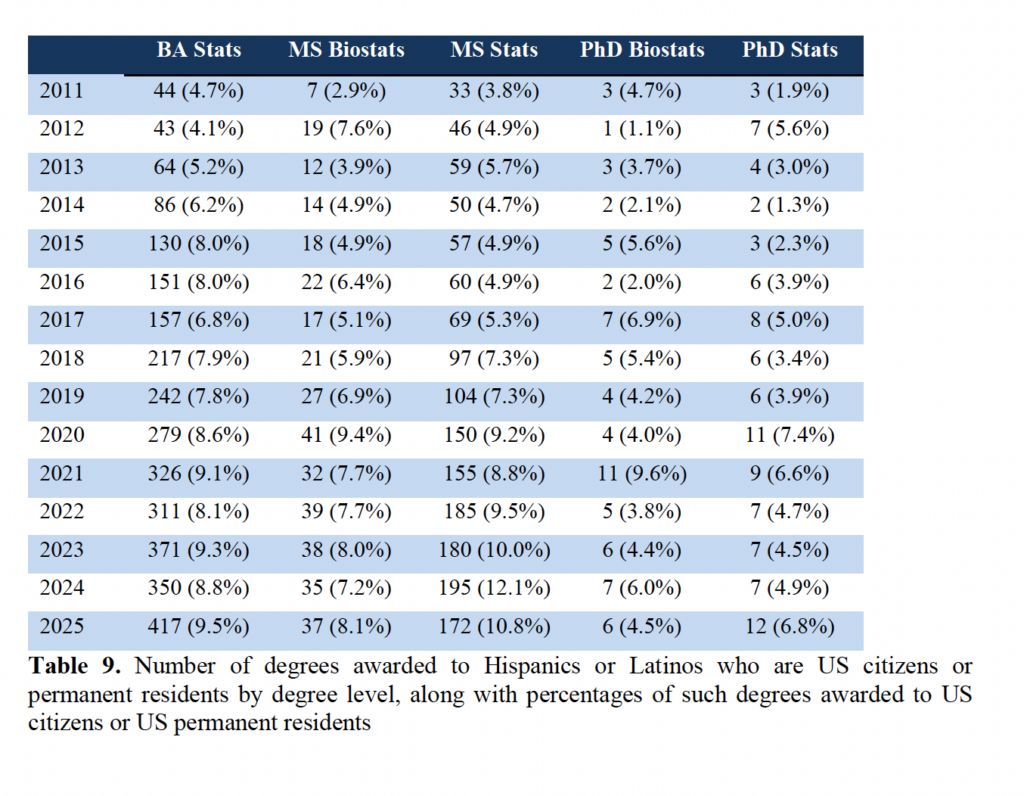
To better understand the percentages in Table 7, consider Tables 8 and 9, which are time series for two under-represented minorities by degree level. For African Americans or Blacks, who are US citizens or permanent residents, the number of doctoral degrees earned are in the single digits and roughly static as a percentage of overall degrees awarded to US citizens or permanent residents. For the bachelor’s level, there’s an increase in the number of degrees, but not an increase in the percentage of overall degrees earned by US citizens or permanent residents. See Figures 7 and 8.
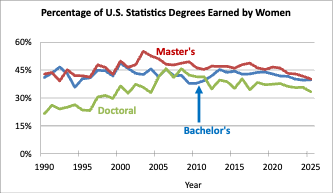
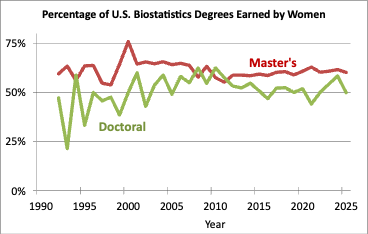
Figures 9–10 show the percentage of degrees earned by women over time by degree level for statistics and biostatistics. The percentage of women earning biostatistics is around 60% for master’s degrees and 50% for PhDs. The percentage of statistics PhDs earned by women seems to have ticked down slightly in the last several years to 33%. For bachelor’s and master’s degrees in statistics, the percentage is approximately 40% for 2025, also representing a small decline in recent years.
Tables Referenced Above
These tables are also available in PDF format.
Leave a Reply