Career Satisfaction: A First Look
The field of statistics is growing and changing. The workforce is demographically diversifying, and the kinds of local and global problems professionals are asked to solve using statistics are expanding exponentially. Given that professionals today have a high lifetime number of employers and are retiring at later ages, there is an interest in differentiating job satisfaction from career satisfaction, with the latter encompassing opportunities and professional contributions extending far beyond the aspects of any particular job.
Statisticians have one of the most satisfying careers, according to mainstream media and occupation experts. Despite this, the ASA has had no organizational record of a study of their members’ career satisfaction in its 175-year history. Therefore, the ASA Committee on Career Development (CCD) submitted a proposal to the ASA to do a career satisfaction survey. In March of 2015, a group consisting of CCD members and representatives of other ASA committees formed to design and implement a career satisfaction study of the ASA members.
An extensive literature search was performed and a validated metric for career satisfaction was identified and used as the study outcome. The study outcome, the career satisfaction score (CSS), was based on five questions, each scored on a five-point Likert Scale from 0 to 4. Thus, the range for CSS was 0 to 20. The career satisfaction survey included CSS questions, demographics, career-related items, and job-related items.
A random sample of 2,002 members was taken and 447 responses were obtained through an online survey service in the last quarter of 2015. A CSS was calculated for every respondent, and the distribution of CSS is in Figure 1.
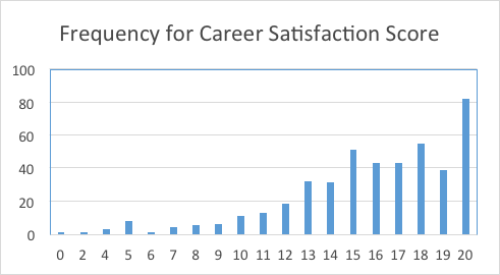
Figure 1: Of the 447 responses, 70% of surveyed members had career satisfaction scores greater than or equal to 15. Nearly 20% of those interviewed had a CSS equal to 20.
Given that data were skewed, quartiles of CSS were analyzed (Table 1).
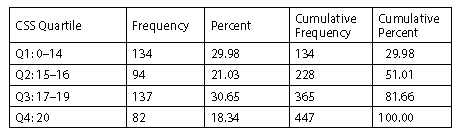
Table 1—Quartiles of CSS, Analyzed
A logistic model predicting for the highest CSS score (i.e., CSS=20) was run. The results emphasized the importance of the ASA membership on high career satisfaction. High career satisfaction was positively associated with membership in only one professional association (i.e., the ASA), membership in the ASA for 10 or more years, and being satisfied with the career development support the ASA offers; high career satisfaction was negatively associated with looking for work in the last three months.
An analysis of career development support showed almost half of ASA members who were surveyed reported not knowing the ASA offers career development support. This finding, along with results of the modeling, suggests a deeper look at career development support—ways members define it, types of support members prefer, types of support the ASA offers, and ways the ASA promotes availability of support—is needed.
Additionally, more effort to engage members in the first 10 years of their ASA membership and to aid those looking for work is warranted. Such efforts may increase career satisfaction for ASA members, especially younger members, and may have implications for member retention.
If you have questions about this article, please contact Monica Johnston through the ASA Community.


 (No Ratings Yet)
Can you provide any more information about the survey? Could we see the questions & response options. The latter would greatly help to interpret the ratings. Did you do any psychometric analysis on the responses?
Bob
This report misuses the term quartile. A quartile is one of 3 cut points that separate the quarters of the data. In this case, there should be 3 of them, not 4. However, the percentages should all be about 25% if they are computed correctly. The quartiles would be some number between 14 and 15, commonly 14.5, between 16 and 17, commonly 16.5 and between 19 and 20, commonly 19.5. The titles of the groups should be Quarters, not Quartiles.
Regards, Charlie.
Quartile 4 …. really ASA?
Welcome!
Amstat News is the monthly membership magazine of the American Statistical Association, bringing you news and notices of the ASA, its chapters, its sections, and its members. Other departments in the magazine include announcements and news of upcoming meetings, continuing education courses, and statistics awards.
ASA HOME
Departments
Archives
ADVERTISERS
PROFESSIONAL OPPORTUNITIES
FDA
US Census Bureau
Software
STATA
QUOTABLE
“ My ASA friendships and partnerships are some of my most treasured, especially because the ASA has enabled me to work across many institutional boundaries and
with colleagues from many types of organizations.”
— Mark Daniel Ward
Editorial Staff
Managing Editor
Megan Murphy
Graphic Designers / Production Coordinators
Olivia Brown
Meg Ruyle
Communications Strategist
Val Nirala
Advertising Manager
Christina Bonner
Contributing Staff Members
Kim Gilliam
Contact us
Amstat News
American Statistical Association
732 North Washington Street
Alexandria, VA 22314-1904
(703) 684-1221
www.amstat.org
Address Changes
Amstat News Advertising