
David A. van Dyk, Past-editor, Journal of Computational and Graphical Statistics
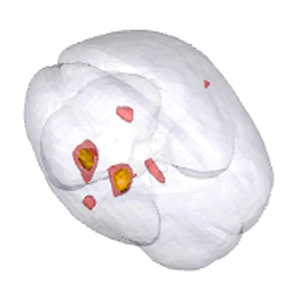
The March issue of the Journal of Computational and Graphical Statistics opens with an editorial overview of the potential usage of animation, 3D visualization, and movies in electronic versions of JCGS articles. An example is the still frame of the MRI brain image, which becomes an interactive 3D graphic in the online article. The supplement to the editorial gives multiple illustrations and point-by-point instructions to authors who hope to jazz up their articles with modern visualization methods. The supplement also links to all the examples. The editorial and the movie supplements are open access.
The editorial points toward what we believe is the future for publication of sophisticated visualization, graphical, and computational methods—an appropriate starting point for an issue focused on innovative statistical graphics, the analysis of massive spatial data sets, boosting, and multiscale techniques.
The scientific portion of the issues begins with a group of four articles on graphical methods. First up is “A Layered Grammar of Graphics,” where Hadley Wickham describes an extended tool that aims to concisely describe the components of a graphic in order to gain insight into its underlying structure. Next, in their colorful article, “Rainbow Plots, Bagplots, and Boxplots for Functional Data,” Rob J. Hyndman and Han Lin Shang describe a new set of graphical tools for visualizing large sets of functional data. Each of the final two papers in the section presents a new type of plot. J. C. Gower, P. J. F. Groenen, and M. Van De Velden present “Area Biplots” to visualize the results of a principle component analysis, and John H. J. Einmahl, Maria Gantner, and Günther Sawitzki present “The Shorth Plot” to investigate probability mass concentration.
The next session is composed of three articles on nonstationary spatial models. It is interesting to compare how all three of them apply their proposed methodology to model U.S. rainfall patterns. Zhengyuan Zhu and Yichao Wu open the section by tackling computational challenges involved with likelihood based estimation and kriging prediction in large nonstationary spatial data in “Estimation and Prediction of a Class of Convolution-Based Spatial Nonstationary Models for Large Spatial Data.” Next, Yu Yue and Paul L. Speckman present a fully Bayesian method based on adaptive thin-plate splines in their article “Nonstationary Spatial Gaussian Markov Random Fields.” The section concludes with Ya-Mei Chang, Nan-Jung Hsu, and Hsin-Cheng Huang’s method for “Semiparametric Estimation and Selection for Nonstationary Spatial Covariance Functions.”
A short section on boosting begins with “Boosting for Correlated Binary Classification,” where Adeniyi J. Adewale, Irina Dinu, and Yutaka Yasui present two variants of boosting that are designed for correlated binary responses. In the second article of the section, Gerhard Tutz and Jan Gertheiss present a feature extraction technique that uses boosting to identify relevant components of the signal in “Feature Extraction in Signal Regression: A Boosting Technique for Functional Data Regression.”
The issues concludes with an article on multiscale inference, “The Block Criterion for Multiscale Inference About a Density, with Applications to Other Multiscale Problems,” by Kaspar Rufibach and Guenther Walther; an article on robust estimation, “An Exact Least Trimmed Squares Algorithm for a Range of Coverage Values,” by Marc Hofmann, Cristian Gatu, and Erricos John Kontoghiorghes; an article on kernel density estimation, “Fast Computation of Kernel Estimators,” by Vikas C. Raykar, Ramani Duraiswami, and Linda H. Zhao; and an article on extracting circadian rhythmic patterns in animal-activity time-series data, “Statistical Computations on Biological Rhythms I: Dissecting Variable Cycles and Computing Signature Phases in Activity-Event Time Series,” by Hsieh Fushing, Shuchun Chen, and How-Jing Lee.
To view the computer code and data sets used in the articles along with additional illustrations and technical details in the online version of JCGS, visit the web site here.
Leave a Reply