
Biostatistics, Statistics Master’s Degrees on the Rebound
Steve Pierson, ASA Director of Science Policy
Download a PDF of all the tables in this article.
This summer’s release of the 2023 degree completion data from the National Center for Education Statistics shows incremental to solid growth for statistics and biostatistics degrees and doubling and tripling for data science and analytics degrees.
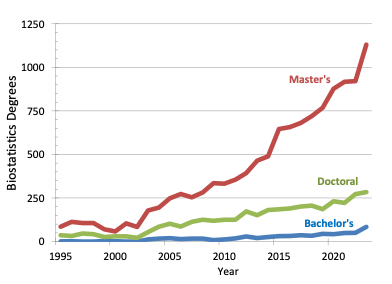
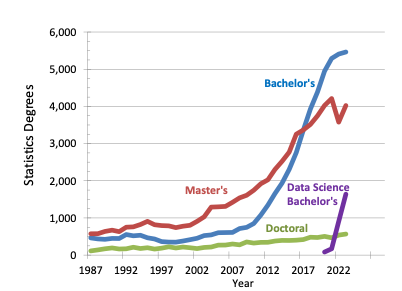
Most notably for statistics and biostatistics, master’s degrees in biostatistics increased 23% over 2022 to 1,130, as shown in Figure 1. Biostatistics PhDs increased 4% to 284, and biostatistics bachelor’s from 50 to 84. The number of bachelor’s degrees in statistics grew 1% to 5,463, and statistics PhD’s 5% to 568, as shown in Figure 2.
Statistics master’s degrees increased by 13% from 2022 to 2023 but followed a 15% drop the previous year, so this degree category is not an all-time high like the five others. The rebound in statistics master’s degrees speaks to an explanation for the drop from 2021–2022 being due to the pandemic. Other possible contributing factors cited last year include declining interest from Chinese students—due to changing job opportunities and work visa availability—and the introduction of closely related degree programs.
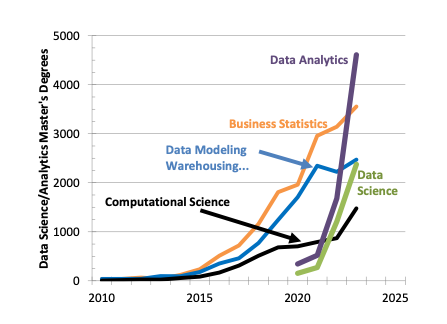
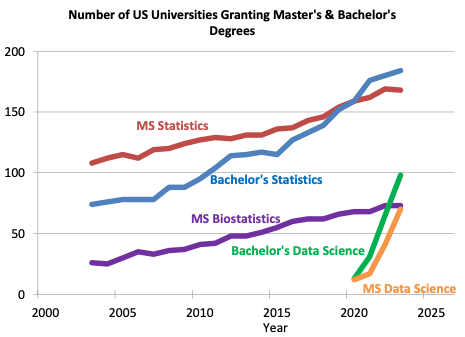
For degrees in data science and analytics, the National Center for Education Statistics introduced two Classification of Instructional Programs, referred to as CIP, codes starting with the 2019–2020 academic year: 30.70 for data science and 30.71 for data analytics. The growth in these degrees at the bachelor’s and master’s levels is dramatic. Bachelor’s degrees in data science increased 81% to 1,639, shown in Figure 2, and data analytics bachelor’s degrees increased 95% to 1,517. Data science master’s degrees doubled to approximately 2,400, as shown in Figure 3. Data analytics master’s almost tripled to exceed 4,600 and now outnumber the other master’s degrees in this category, including statistics. The number of universities awarding those degrees each increased more than 70% (see Figure 4 and Table 1).
Prior to the introduction of the data science and analytics CIP codes, the ASA used three other codes as a proxy to track the growth of such master’s programs: Business Statistics; Data Modeling/Warehousing & Database Administration; and Computational Science. As also seen in Figure 4, these degrees also saw strong growth, more than 10% for the first two and 70% for computational science. As shown in Table 1, on the other hand, the number of universities awarding master’s degrees with these three CIP codes was flat.
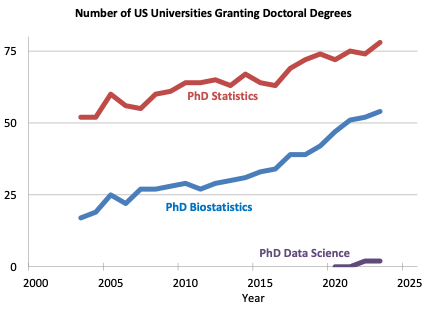
Figures 4 and 5 show the number of universities awarding bachelor’s and doctoral degrees in statistics and biostatistics increased modestly from 2022–2023. For master’s degrees, these numbers were flat. Nine universities granted biostatistics degrees at the bachelor’s level in 2022.
The following 12 universities granted statistics and biostatistics degrees for the first time (at least since 2003) in 2023:
- Bachelor’s degrees in statistics (7): California State University at Long Beach; Adelphi University; Bucknell University; Mercer University; Simmons University; Vermont State University; and Xavier University of Louisiana
- Master’s degrees in statistics (3): Arizona State University Digital Immersion; Graceland University-Lamoni; and University of Massachusetts-Amherst
- PhD in biostatistics (1): Drexel University
- PhD in statistics (1): University of Massachusetts-Amherst
The top degree-granting institutions over the last five years are in the following tables for all categories except biostatistics bachelor’s degrees.
Demographics
Following our practice of alternating demographics updates, following are the breakdown of degrees for race and ethnicity data and by nonresident aliens and US citizens or residents. Last year’s update, which was based on 2022 degree data, had figures for the percentage of statistics and biostatistics degree earned by gender.
As shown in Figure 6, the percentage of master’s and doctoral degrees in statistics awarded in recent years to nonresident aliens is near 60% and 70%, respectively. For the same degree levels in biostatistics, it is in the range of 50–55%. The percentage for bachelor’s degrees in statistics ticked down a couple percentage points to 27% percent for 2023 over the previous several years.
The National Center for Education Statistics has race and ethnicity data for the degrees granted to US citizens or residents but does not have such data for nonresident aliens. Table 6 shows the race and ethnicity breakdown of the US citizens and residents averaged for 2011–2023. For the five degrees—not including biostatistics bachelor’s for which the numbers are small—the percentage of degrees earned by those who report their race as American Indian or Alaska Native (AIAN) is essentially 0%. For those identifying as Asian (ASIA), the percentage is in the range of 18–27%. It is 3–5% for those identifying as Black or African American (BKAA). The percentage for individuals of Native Hawaiian or Other Pacific Islander (NHPI) descent is 0–1%. The percentage for those individuals who identify as white (WHIT) is 55–62% and, for individuals who report two or more races (2MOR), it is 1–4%. For those identifying ethnicity as Hispanic or Latino (HISP), the percentage is 4–8%. Finally, the percentage for those reporting race/ethnicity unknown (UNKN) is 3–9%.
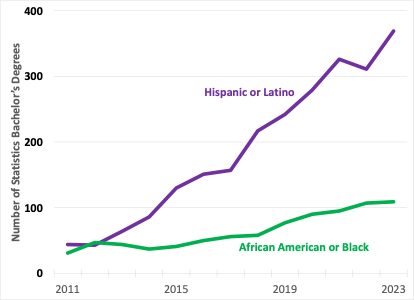
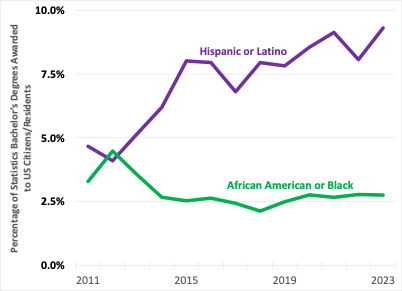
To better understand the percentages in Table 6, consider Tables 7 and 8, which are time series for two under-represented minorities by degree level. For African Americans or Blacks who are US citizens or permanent residents, the number of doctoral degrees earned are in the single digits and roughly static as a percentage of overall degrees awarded to US citizens or permanent residents. For the bachelor’s level, there seems to be an increase in the number of degrees, but not an increase in the percentage of overall degrees earned by US citizens or permanent residents (see Figures 7 and 8).
For Hispanics or Latinos, the doctoral numbers are in the single digits, with little or no movement over the decade. For bachelor’s and master’s in statistics, the numbers are increasing and, as a percentage, also seemingly increased from 2011–2013, as shown in Figures 7 and 8 for bachelor’s degrees.
See Michael Rappa’s thorough data on analytics and related degrees at his NCSU site: https://analytics.ncsu.edu/?page_id=4184.