
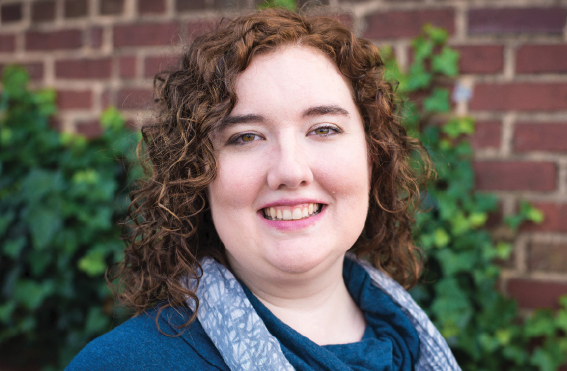
Amanda Malloy, ASA Director of Development
The Centers for Disease Control and Prevention (CDC) has been mentioned or referenced almost daily since the COVID-19 outbreak. Local and state governments, the White House, business owners, and the general public depend on the data, analysis, and guidelines recommended by the CDC to make important decisions. However, not everyone knows how complicated it is to collect, clean, and analyze the data related to the pandemic and communicate it in a way that is easy to understand.
There are statisticians working tirelessly to wrangle and analyze data and come up with innovative data visualizations anyone can understand. That’s not an easy task! Therefore, when I was given the opportunity to talk to Stephanie Dietz, a statistician at the CDC who is part of the Innovation, Technology, and Analytics Task Force (currently focused on COVID-19), I jumped at the chance.
Following is a bit of my interview with her (edited slightly for clarity):
How did you end up on the CDC’s COVID-19 data analysis team?
In my normal job, I work in the Division of Laboratory Systems (DLS) as a statistician, analyzing national laboratory test result data. At the beginning of March, another division in our center, the Division of Health Information Systems (DHIS), started the process of receiving SARS-CoV-2 laboratory data orders and results from commercial laboratories. The technical complexities of this task required a collaboration between DHIS and DLS. As a result, staff from DHIS and DLS were deployed to the CDC Data and Analytics Task Force and I was asked to co-lead the effort of validating the commercial laboratory data for CDC.
What work is the data analysis team responsible for? What is your part?
We are responsible for the commercial laboratory data orders and results being sent to CDC from six commercial laboratories. I am the commercial laboratory data co-lead, and we oversee a team of analysts working to validate and stand up these new data streams. We’re getting all coronavirus-related laboratory tests, regardless of result outcome or type of test, from six commercial laboratories.
We are also responsible for reporting on the data daily and working with other statisticians and analysts to incorporate the data into other reports and models. Our daily reports on the data and the work we’re doing with other statisticians and analysts to incorporate the data into other reports and models are being used by CDC and HHS leadership to inform decision-making. Laboratory data testing reports can also be seen on the CDC website.
What does your typical workday look like?
I am working from home now. We have daily stand-ups and meetings, which were already in place prior to the response and working from home. The hardest part of my day is working with a toddler knocking on my office door! While I miss asking my colleagues to come over and look at my screen, I am so impressed with the technology and innovation available to get our jobs done.
I don’t currently have a “typical” workday. Every day has been varied and different, with unique and unexpected challenges. It can range from technical issues to fun analytic questions to requests with very quick turnarounds. I used to joke that there was no such thing as a statistical emergency, but this response has turned that on its head.
What are some of the major technical challenges facing you and the team? For example, is your technical workflow challenging?
Our biggest challenge is data formatting. As I’m sure most ASA members know, data cleaning and validation is often the hardest and longest part of any analytic process. We are receiving hundreds of thousands of records from multiple sources, each with slightly different formats. However, we have an outstanding team of statisticians, database managers, program coordinators, and administrative staff that have found quick, accurate, and creative solutions to ensure our data stay flowing and timely.
What are some things you find yourself doing/thinking/saying that you never thought you would?
I, for one, never thought I’d consider going to a drive through to pick up dinner a major outing or have happy hour by Zoom. I also never thought I’d have to teach preschool and second grade at the same time. I can honestly say I never thought I would find myself apologizing to senior leadership at the CDC for my toddler making a cameo appearance on our video conference call.
Leave a Reply