2020 Master’s Graduates Land on Feet Despite COVID-19
Steve Pierson, ASA Director of Science Policy
The class of 2020 graduated into uncertain times and a job market deeply affected by the COVID-19 pandemic. Nevertheless, the statistics and biostatistics master’s graduates in the job market who responded to the ASA follow-up survey seem to have landed on their feet, reporting similar employment figures as the class of 2018 cohort reported.
With the limitation that neither the survey results reported here nor for the previous cohort are fully representative of the several thousand graduates for each, the respondents have a similar unemployment rate—less than four percent—and the salaries are generally higher than two years prior. Similarly, job satisfaction rates remain high.
The survey did not ask pandemic-specific questions; however, many respondents referred to the stress, duration, and difficulty of their job search due to hiring freezes and limited options during the pandemic. Figure 1 is an arrangement of the words used by those respondents.

Figure 1: Words used to describe the job search during the COVID-19 pandemic
The survey results provide insight into the work statistics, biostatistics, and data science graduates are doing—including the variation thereof—and the types of jobs they are obtaining.
Besides yielding insights into the job market for master’s graduates in statistics and related fields, the survey results are helpful to those reviewing the free responses of the survey participants who shared their experiences, reflections, and advice.
Survey Respondent Overview
Four hundred three individuals responded to the survey and indicated having earned a master’s degree in statistics, biostatistics, or a related field during the 2019–2020 academic year. Not all completed the entire survey. Of the 304 responding to the gender question, 51 percent identified as female, 48 percent as male, 1 percent as other, and 1 percent as preferring not to say. The median age of the respondents at the time of master’s receipt was 26, and the mean age was 27.
For the 301 students providing citizenship status, 65 percent are US citizens and 3 percent are permanent residents (green card holders). Eleven percent had the Optional Practical Training (OPT) visa, 3 percent had an H1-B visa, and 16 percent had another temporary visa. For respondents who are not US citizens, 64 are from China, nine from India, four from Canada, three each from South Korea and Taiwan, and the remaining 12 from 11 other countries. Respondents were not asked for race or ethnicity information.
The respondent demographics of this survey can be compared with the overall master’s graduates in statistics and biostatistics reported by the National Center for Education Statistics (NCES) for the most recent year for which data is available (2020). There were approximately 4,000 statistics and 900 biostatistics master’s graduates in the US in 2020. Of these, 47 percent of statistics master’s recipients are female, 61 percent for biostatistics. US citizens and permanent residents are overrepresented in this survey’s respondents as they have only accounted for 42 percent of the overall master’s degrees in recent years.
Based on the number of respondents providing the specific field of their master’s degree, there are almost as many biostatistics master’s graduates represented in these survey results as the other categories combined.
Documenting the wide draw of statistics and biostatistics master’s programs, 360 respondents reported 58 bachelor’s degree fields. The most common were mathematics- and statistics-related degrees, as listed first in Table 1. Nearly 43 percent of the respondents had an undergraduate degree in a field other than mathematics and statistics, the most common being biology and economics, also shown in Table 1.
Master’s graduates from nearly 80 departments participated in the survey: Columbia University biostatistics (24); North Carolina State University (21); University of Michigan biostatistics (15); Carnegie Mellon University (13); University of Kansas Medical Center biostatistics (13); University of California, Los Angeles biostatistics (12); University of Michigan (11); University of Minnesota, Twin Cities (10); Duke University biostatistics (9); and Georgetown University biostatistics (9).
The respondents generally fall into two categories. Of the 403 who provided their employment and enrollment status as of March 1, 2021, 235 reported themselves as employed—228 full time—and nearly a third as a student, as shown in Table 2. Fifteen of these respondents (3.7 percent) reported themselves as unemployed and seeking. The corresponding unemployment rate for the 420 class of 2018 graduates was 3.6 percent.
Employed
For the 155 full-time employees who reported their annual salary, the median was $75,000. While this amount is $2,000 less than the corresponding number for the 2018 master’s cohort, the decrease is likely an artifact of the overrepresentation of biostatistics master’s graduates. For the 16 individuals reporting hourly pay, the median was $32/hour, with the middle half being in the range of $22.50/hour – $34.50/hour. As shown in Table 3, the median salary for females with a statistics master’s was lower than for the corresponding males. The lower overall median salary for females is largely explained by breaking down salaries by degree field and employment sector.
Comparing the respondents from the classes of 2018 and 2020 by master’s degree field, median salary for the more recent graduates is higher for general statistics and biostatistics, the same for applied statistics, and lower for data science. This is shown in Table 4, where N is the total number of respondents from the class of 2020 who reported both full-time employment and employment sector; “n” is the subset of respondents who reported salary. For the 2020 cohort, the number of females reporting annual salary is shown in parentheses. Those whose specific degree field is biostatistics are 44 percent of those providing salary for the 2020 class, versus 39 percent for the class of 2018. Therefore, the median salary for biostatistics master’s degree field being the smallest of the four main areas in this year’s survey partially explains the decline in the overall median salary noted above. Similarly, the lower median salaries for females overall could partially be explained by the fact that 62 percent of the 69 respondents reporting biostatistics as their master’s degree field (and providing their salary) are women.
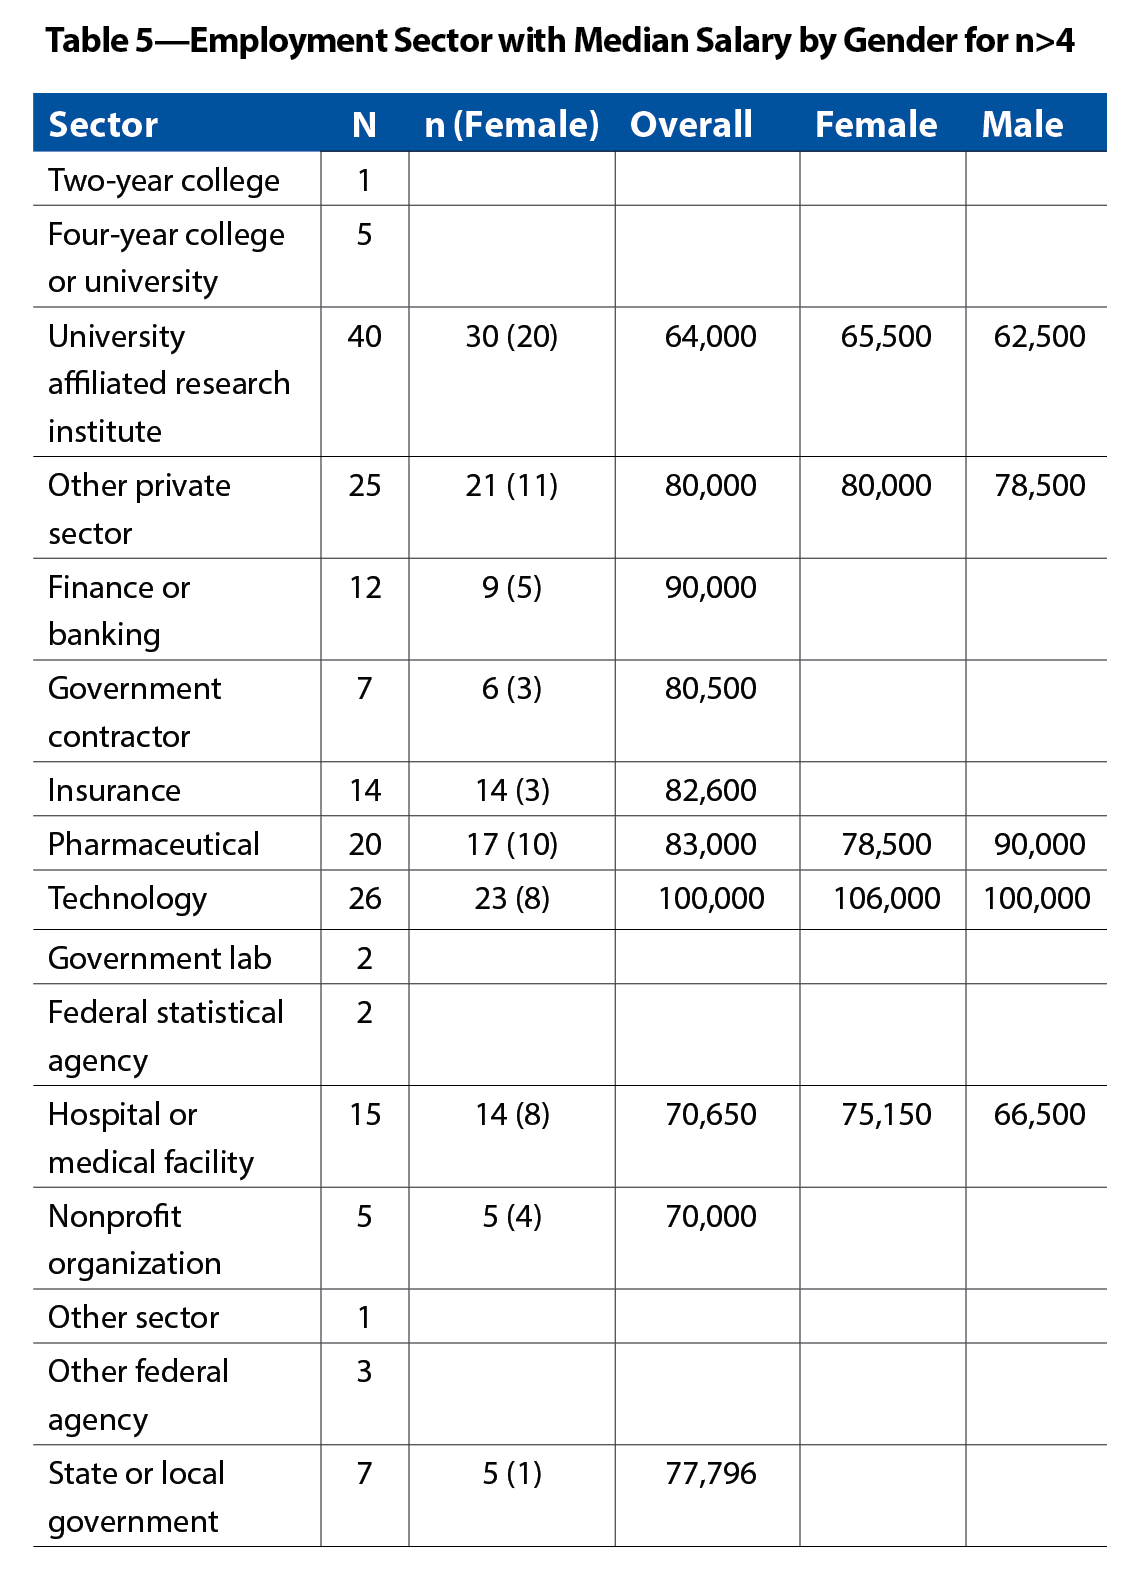
The fraction of women in each employment sector also partially explains the differences in median salary by gender. Table 5 shows the total number, N, of respondents who reported sector and the subset, n, who also provided salary (for n>4). The number in parentheses in Column 3 is the number of women. The employment sectors in which women tend make up the majority of respondents providing salary (e.g., university-affiliated research laboratory and nonprofit organization) tended to have the smaller median salary. Conversely, only 35 percent of respondents are women for the technology sector, which has the largest median salary. Breaking down the median salary by sector, it is larger for the female respondents in three of the four sectors for which there are at least five female and five male respondents. The “other private sector” fill-in responses varied, with some form of consulting being roughly a third.
Median salaries varied substantially by state, as show in Table 6, likely explained in part by the employment sector predominant in that state.
The overall median salary of $75,000 compares well with salaries projected for the broad categories of engineering, computer science, business, and math and sciences by the National Association of Colleges and Employers (NACE). See Table 7 showing the 2020 and 2021 NACE projections.
As was the case previously for both this survey and the ASA statistics bachelor’s survey, numerous and diverse companies hired master’s graduates into positions with a wide assortment of job titles. For the 172 employed respondents who provided the name of their employer, there were 161 unique names. Similarly, there were more than 109 unique—although similar—job titles. The most common were data scientist (20), biostatistician (18), data analyst (9), biostatistician I (7), and statistician (5).
Respondents were also asked the number of job offers they had at the time they accepted their position. The distribution was similar to the class of 2018 cohort, with 4.3 percent of the 185 respondents not receiving an offer (4.8 percent for class of 2018), 51 percent receiving one offer (49 percent for class of 2018), 30 percent receiving two offers (27 percent for class of 2018), 10 percent receiving three offers (13 percent for class of 2018), and 4.9 percent receiving four or more offers (3.9 percent for class of 2018).
For how influential graduates felt their statistics-related master’s degree was in securing their current position, 95 percent of respondents responded influential, with 77 percent reporting very influential. Eighty-four percent reported being satisfied with their position (52 percent very satisfied), 81 percent with salary and benefits (41 percent very satisfied), 90 percent with job security (59 percent very satisfied), 81 percent with opportunity for advancement (42 percent very satisfied), 77 percent with intellectual challenge (47 percent very satisfied), and 89 percent with level of responsibility (46 percent very satisfied).
Three general themes came up often in the descriptions of job search experiences and how respondents located and secured their positions. The most common was the role of online postings and websites such as LinkedIn and Indeed in helping land a job. The importance of both internships and personal and professional social networks was also noted frequently in helping to secure a position. Other strong themes that came through were persistence, flexibility, and spreading of a wide net. The following are a sampling of the responses:
- “Found through previous internship”
- “LinkedIn, referrals, job fairs, Handshake”
- “Difficult during a pandemic. Lots of online searching and lots of applications.”
- “Used university job portal and connections to MS program”
The survey sought to understand the nature of the work undertaken by master’s graduates. Sixty-two percent reported solving technical problems on a daily basis, and 65 percent reported working on a team as often, as shown in Table 8. At least 40 percent of respondents reported engaging in database management, quality control, and project management on a daily basis. The next most common were technical writing, nontechnical writing, and working with clients.
The American Statistical Association contracted the Statistical Research Center of the American Institute of Physics (AIP) for the survey of both bachelor’s and master’s graduates in statistics and biostatistics in 2020. The ASA provided department names and contacts for the departments granting statistics or biostatistics degrees according to our records. For both the bachelor’s and master’s graduates, AIP reached out to 232 departments, receiving the names and contact information for 1,921 master’s graduates who received up to four invitations to participate in the survey. Departments that did not provide contact information for graduates were asked to distribute survey invitations to their alumni. The survey of 2020 graduates followed closely that of the class of 2018.
The ASA will conduct this survey again in two to three years. Send your suggestions for how to improve it and topics to cover or omit to Steve Pierson.
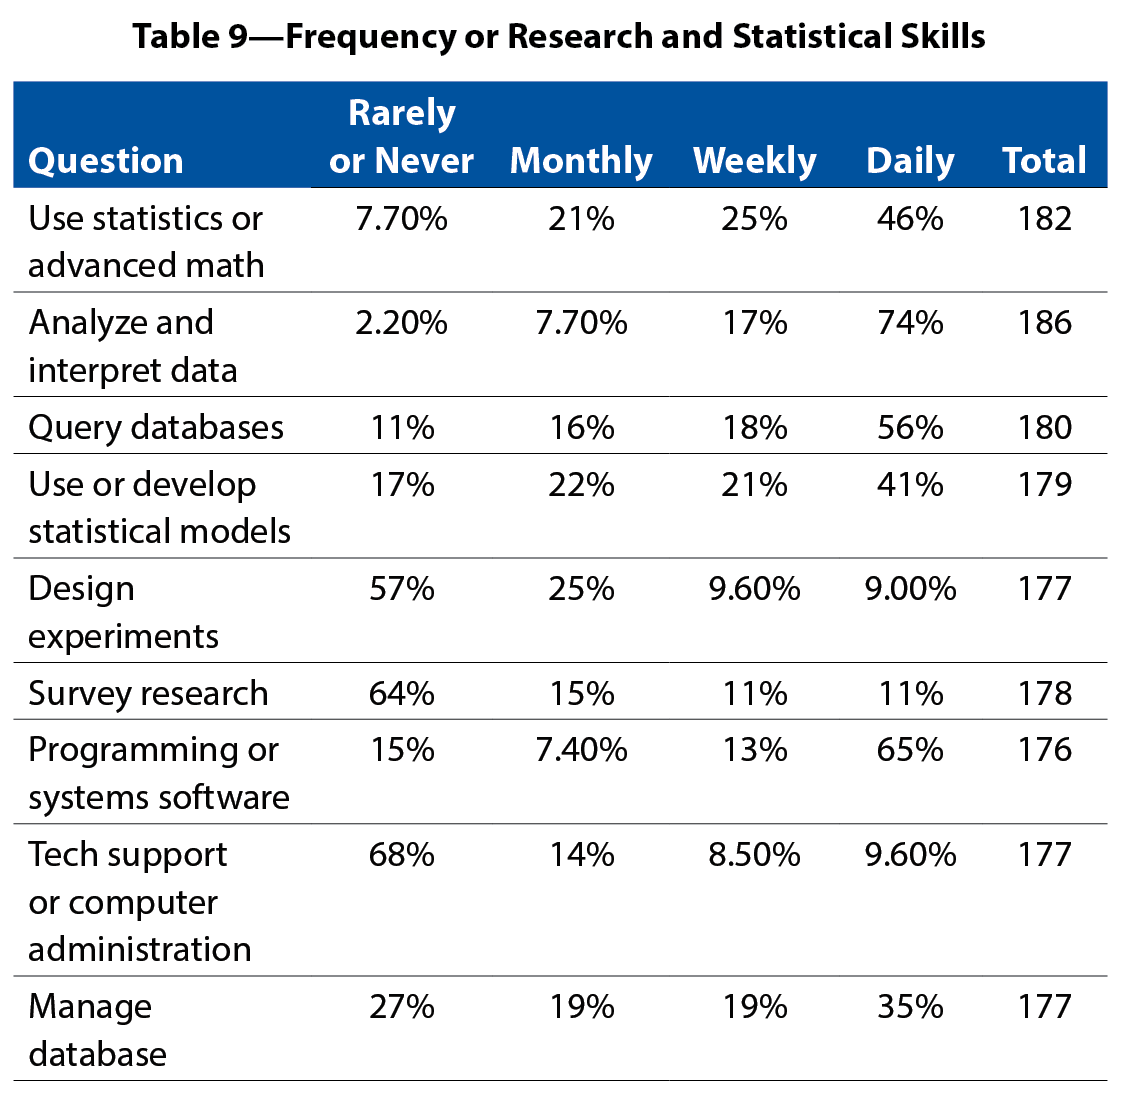
The most frequently used technical skills were analyzing/interpreting data (74 percent daily) and programming or systems software (65 percent), as shown in Table 9. More than half the respondents did database querying on a daily basis. The next most often–used skills, done at least weekly by 60 percent of the respondents, were using statistics or advanced math and statistical model use or development. Looking at daily use of technical skills by master’s discipline, as shown in Table 10, there is little variation for applied statistics, biostatistics, and general statistics.
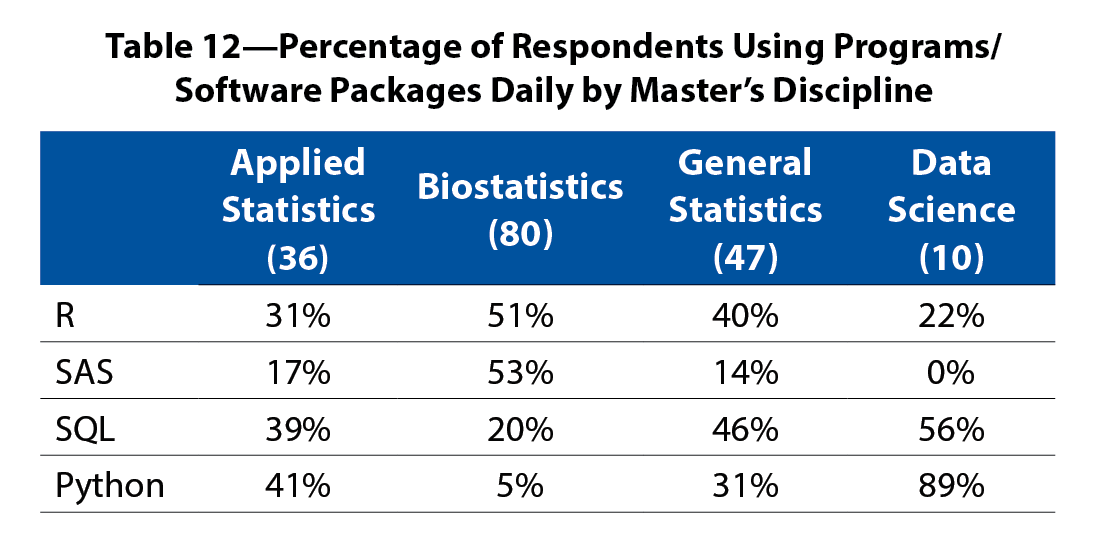
The top software programs in terms of daily use were R (42 percent), SQL (33 percent), SAS (32 percent), and Python (25 percent), as shown in Table 11. In contrast, the software programs reported to be least used in their positions were Minitab (1 percent), Java (5 percent), JMP (4 percent), and SPSS (4 percent). Excel was mistakenly omitted from this year’s survey but was highly used for the class of 2018 respondents. Daily use of the top four software programs varies—sometimes widely—by master’s discipline (see Table 12). The daily use of Python, for example, varied from 5 percent for those with a master’s in biostatistics to 90 percent for the approximately 10 data science master’s respondents.
Students
For the graduates who were enrolled in a full-time degree program, 89 were in a doctorate program, 10 in a master’s, and five in other programs. Twenty-nine of these were in a statistics program, 48 in biostatistics, and six in data science. Of the 23 other fields of study, the following programs each had two or more respondents enrolled: economics (4); mathematics (3); biology (2); health (2); computer science (2); psychology (2); and education (2). Forty-four of the students in a biostatistics doctoral program also earned their master’s in biostatistics, 19 for statistics.
Reports on Master’s Studies and Job Search Experiences
Respondents were generally satisfied with their master’s degree training. Eighty-nine percent of respondents reported they agreed their master’s program prepared them to effectively analyze and interpret data critically using statistical models, with 44 percent strongly agreeing. Eighty-two percent agreed their master’s program prepared them to effectively analyze and interpret data critically using computational methods, with 37 percent strongly agreeing. Seventy-nine percent agreed their program prepared them to effectively communicate—both orally and in written form—results of statistical analyses to a variety of audiences, with 34 percent strongly agreeing.
Respondents were asked to comment about what they might do differently when looking back at their master’s education. The responses were varied, covering such topics as taking better advantage of the available resources and educational opportunities to learning more coding, computer programming, and statistical/database software to seeking more experience within their industry of choice and real-world applications of their degree program. Here are four of the more than 100 responses:
- “I would have learned more programming, sooner. My stats degree was great! But it’s a starting point, doesn’t provide all I need. We did learn some programming but it’s just a skill I need much more of.”
- “More chances to develop and grow professional connections. For myself, I don’t have people in my daily life that can connect me to someone in the field. It still feels very much like it’s who you know.”
- “More focus on soft skills and real world analysis.”
- “Build stronger relationships with a variety of faculty members and students to grow my professional network.”
All the responses can be found in the supplemental materials linked at the end of this article.
Graduates were also asked what types of experiences, training, or other qualifications they feel would have helped them secure a position. Among the roughly 10 respondents, several mentioned learning programming languages such as SQL and Python, and three mentioned internships. Here are a few of the responses:
- “Experience in Python and SQL. More than one year working experience in related roles.”
- “More programming experience and more experience in internships doing applied work”
- “Big data platform experience (AWS, GCP), more project based learning, more software development overlap.”
For their job search, 67 percent said their statistics department or faculty provided career guidance, and 37 percent said they used the campus career counseling center. Sixty-six percent of the latter found their engagement with the career counseling center useful. The free responses to why or why not the center was helpful varied. Several commented that the interview coaching was helpful, while others appreciated the help with résumés or identifying positions for which to apply. A few commented that their center didn’t seem equipped to help identify jobs with their expertise or interests. Select responses include the following:
- “Helpful perspective and sanity check. Made me feel like I wasn’t alone with the search and they were on my side.”
- “I frequently went to career counseling center before I graduated. The staffs there were very helpful in helping me put together a professionally looking résumé and giving me practical advice for salary negotiation.”
- “I used the career center weekly around the time I was interviewing for jobs. They helped me feel much more comfortable with interviewing.”
- “They helped me restructure my résumé and advised me on keywords to help me find the right job.”
- “They don’t have experience with placing individuals with advanced degrees in STEM fields. They don’t know what opportunities are out there, or what job networks to direct students towards.”
Finally, respondents were asked for additional comments or advice for current statistics students. The responses generally focused on actively taking advantages of the breadth of opportunities to gain knowledge, experience, skills, connections, and perspective, as exemplified in the following responses:
- “Build strong foundations on statistics and probability before jumping into machine learning and modeling. Learn to see the bigger picture and not just focus on modeling. Modeling is a small part of a Data Scientist’s job. The larger part of the job is understanding and the problem and communicating effectively the solutions as actionable insights.”
- “Utilize as much materials and resources at your disposal. As a foreigner, don’t be shy to approach for help. Try to get as much hands-on experience, such as research work. Network.”
- “It’s hard to break into the data science field if you are not competent in Python.”
- “Get comfortable communicating about statistical insights, it’s no use if you can’t tell other people about what you discover.”
- “Having a strong math/stats background pays off immediately. It allows you to think critically and generalizes well to other problems. My advice for graduating students for immediate success is to work on programming (R, Python, and SQL) and business skills.”
- “Make sure that learning doesn’t end with coursework or the primary objectives of your research. Specifically, continually try to improve your coding skills, ability to work with new software, understanding of new study designs and statistical methods, writing skills, presentation skills, management skills, having difficult conversations in the workplace, etc.”
- “Please make use of the American Statistical Association’s mentoring services. I was a recipient of an ASA award and Diversity Workshop Mentoring Program graduate in my MS tenure and it made all the difference in helping me figure out where I wanted to go with my degree.”
- “Get a job or internship in analytics. If you can’t, build a nice portfolio of analytics projects with a variety of problems and technologies to showcase capabilities. Having a degree is not sufficient.”
Read the report for the 2020 bachelor’s graduate survey.
Supplemental Materials
- Questionnaire
- Participating Universities
- Job Titles
- Companies Employing Graduates
- Career Center Use
- What I Would Have Done Differently
- Advice for Current Students, Additional Comments
- Job Search Experiences
- Response Summaries


 (No Ratings Yet)


Good sharing with us
google