
Steve Pierson and Kiana Moore
The 2023 statistics and biostatistics master’s graduates who responded to the ASA follow-up survey in spring 2024 came to their graduate program with undergraduate majors in 45 fields and then—in an embodiment of John Tukey’s quote, “The best thing about being a statistician is that you get to play in everyone’s backyard”—diverged into careers and studies in a variety of sectors, regions, and fields.
As in past years, this year’s respondents have an unemployment rate in the range of 3–5% and the salaries are generally higher than three years prior. Similarly, job satisfaction rates remain high.
This year’s survey was updated to reflect changes spurred by the maturation of data science and wider use of machine learning and artificial intelligence.
The survey results provide insights into the work being done by statistics, biostatistics, and data science graduates—including the variation thereof—and the types of jobs they are obtaining. In addition, the results will be especially beneficial to those who review the free responses of the survey participants, who shared their experiences, reflections, and advice.
The ASA also surveyed 2023 bachelor’s graduates in statistics and biostatistics. A similar report based on their responses will appear in the December issue of Amstat News.
Survey Respondents
Responding to the survey and indicating they earned a master’s degree in statistics, biostatistics, or a related field during the 2022–2023 academic year (hereafter noted as 2023 graduates) were 337 individuals. Not all completed the entire survey. Of the 270 responding to the gender question, 40% identified as women, 59% men, and 1% other. The median age of the respondents was 25 and the mean age was 27.3.
Of the 273 students providing citizenship status, 61% were US citizens and 3% were permanent residents (green card holders). Sixteen percent had the Optional Practical Training visa, 3% an H1-B visa, and 14% another temporary visa. For respondents who are not US citizens and provided country of citizenship, 65 are from China, 10 from India, 6 from Ghana, 5 from South Korea, and the remaining 18 from 14 other countries. Respondents were not asked for race or ethnicity information.
The respondent demographics of this survey can be compared to that of the overall master’s graduates in statistics and biostatistics reported by the National Center for Education Statistics for the most recent year for which data are available (2023). There were approximately 4,000 statistics and 1,100 biostatistics master’s graduates in the US in 2023. Of these, 43% of statistics and 61% of biostatistics master’s recipients were women. US citizens and permanent residents are also overrepresented in this survey’s respondents, as they have only accounted for 44% of the overall master’s degrees in recent years.
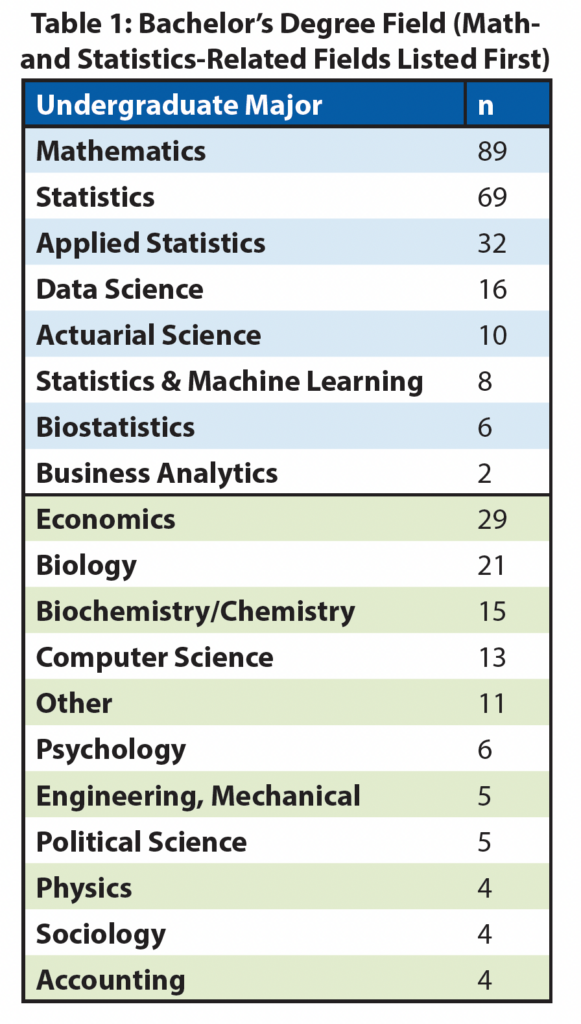
Documenting the wide draw of statistics and biostatistics master’s programs, 389 respondents reported 45 bachelor’s degree fields. The most common were mathematics- and statistics-related degrees. Forty percent of the respondents had an undergraduate degree in a field other than mathematics and statistics, the most common being biology and economics (Table 1).
Master’s graduates from nearly 78 departments participated in the survey, the most represented being University of Michigan statistics (24), Texas A&M University (23), University of Michigan biostatistics (22), University of Illinois at Urbana-Champaign statistics (19), Columbia University statistics (17), Duke University biostatistics (13), University of California at Davis statistics (12), New York University statistics (10), University of Wisconsin-Madison statistics (10), University of Kansas Medical Center statistics (8), University of Virginia statistics (8), San Diego State University statistics (7), and The University of Texas Health Science Center at Houston statistics (7).
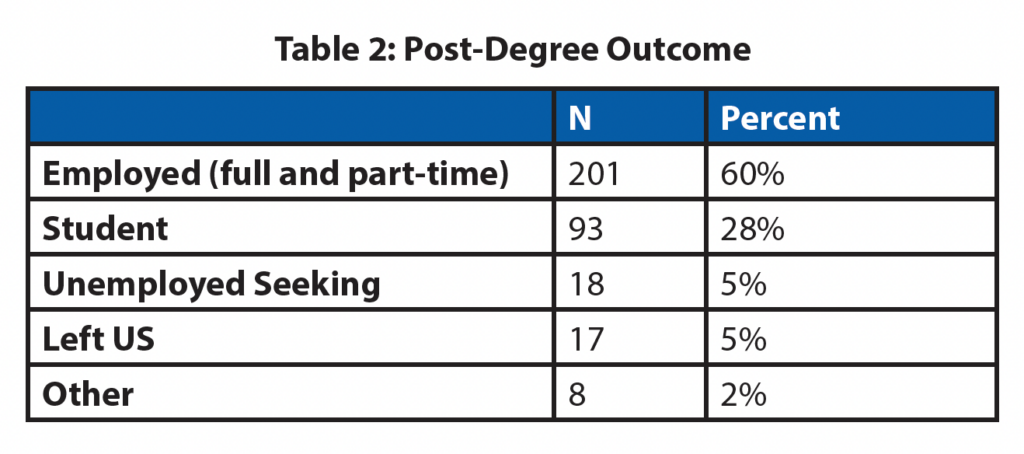
The respondents were generally either employed or continuing their studies. Of the 337 who provided their employment and enrollment status as of March 4, 2024, 201 reported themselves as employed—191 full-time, 10 part-time—and nearly a third as a student, as shown in Table 2. Eighteen of these respondents (5.3%) reported themselves as unemployed and seeking. The corresponding unemployment rates for the 420 class of 2018 graduates was 3.6%; the 403 class of 2020 graduates was 3.7%.
Employed
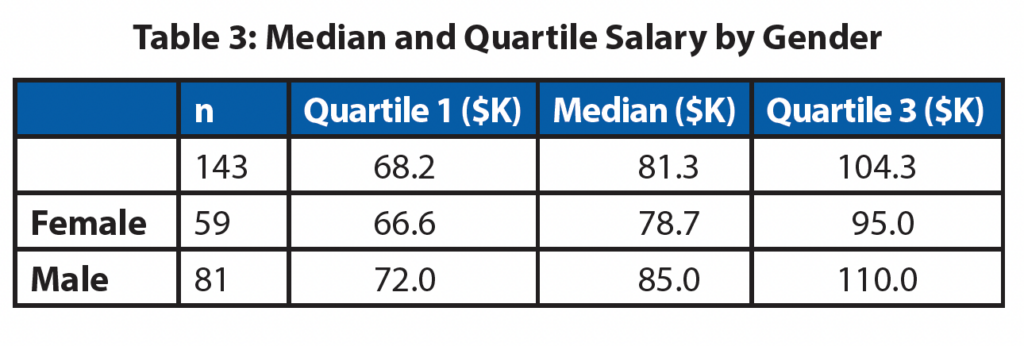
For the 143 full-time employees who reported their annual salary, the median was $81.3k, as shown in Table 3, which is also broken down by gender. While this amount is more than that of the 2020 master’s cohort median of $75k, these salaries are a small sample of the total population and should be analyzed with caution. Salaries tend to depend on the master’s specific field. We also recommend against drawing conclusions on gender salary comparisons because of the limits of our results.
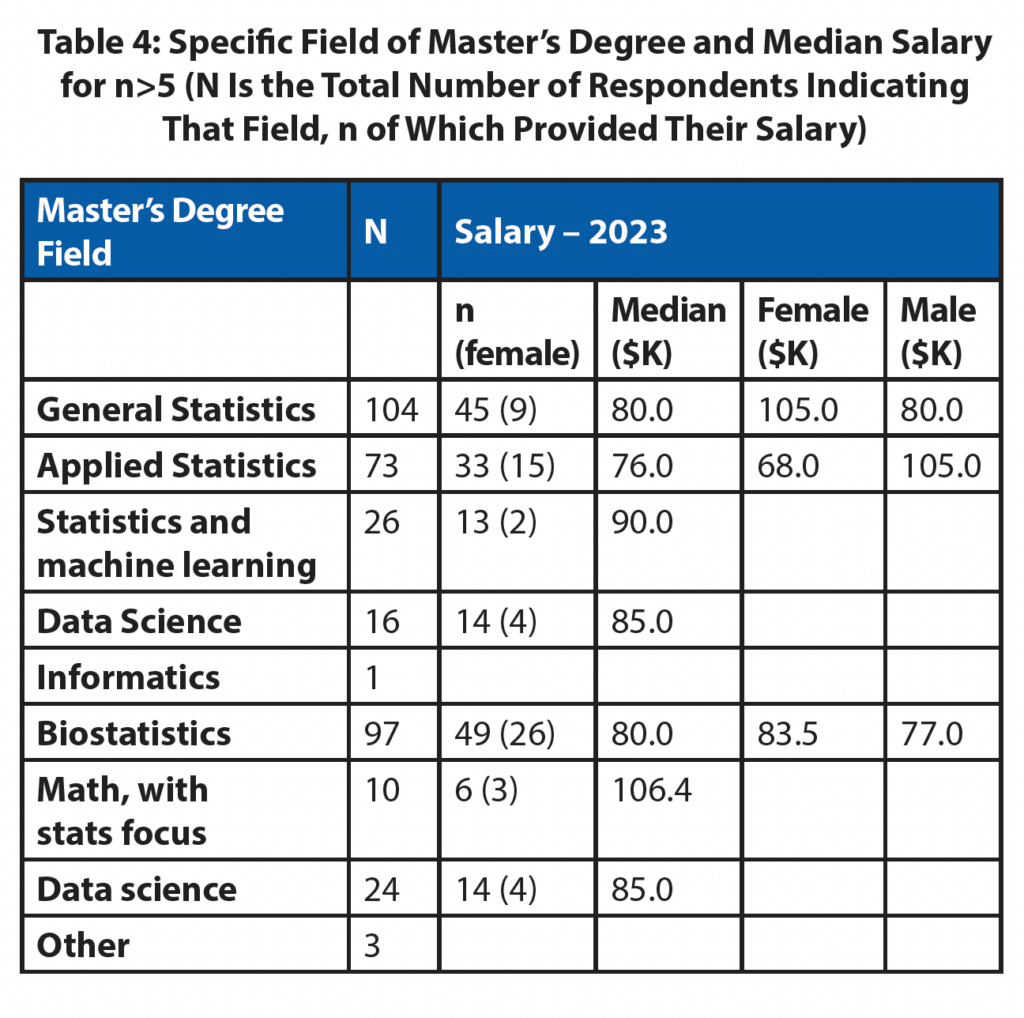
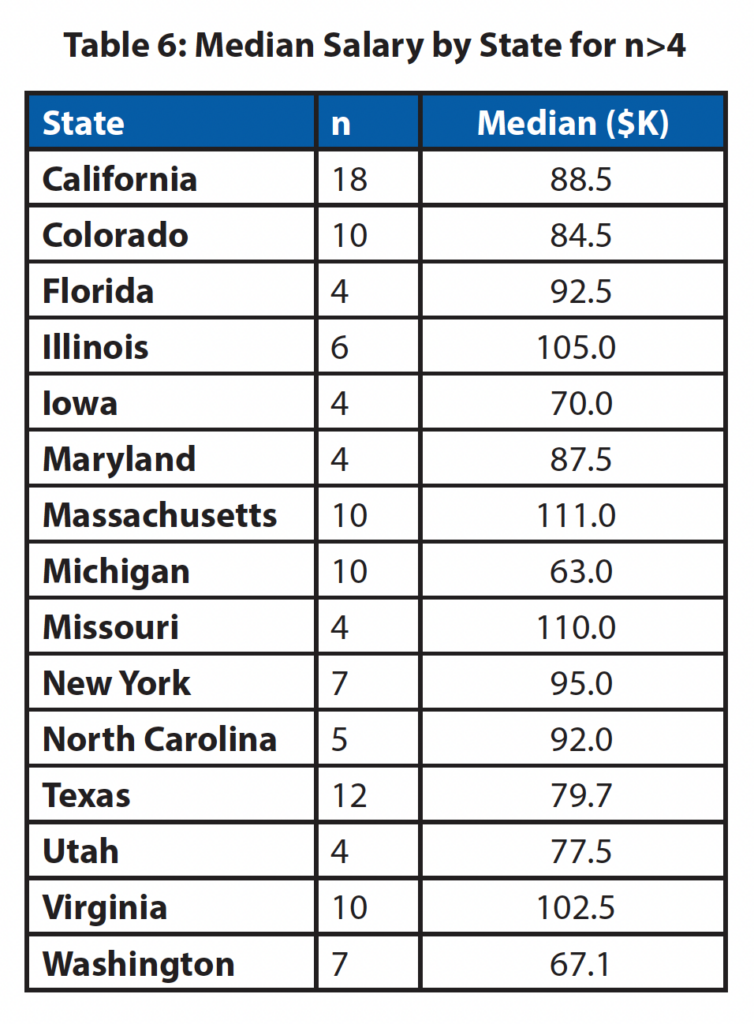
The next three tables show the median salaries as broken down by specific field of the master’s degree (Table 4), employment sector (Table 5), and state (Table 6). For the first two tables, N is the total number of respondents from the class of 2023 who reported that category, “n” is the subset who reported salary, and the number in parentheses is the number of n who are female.
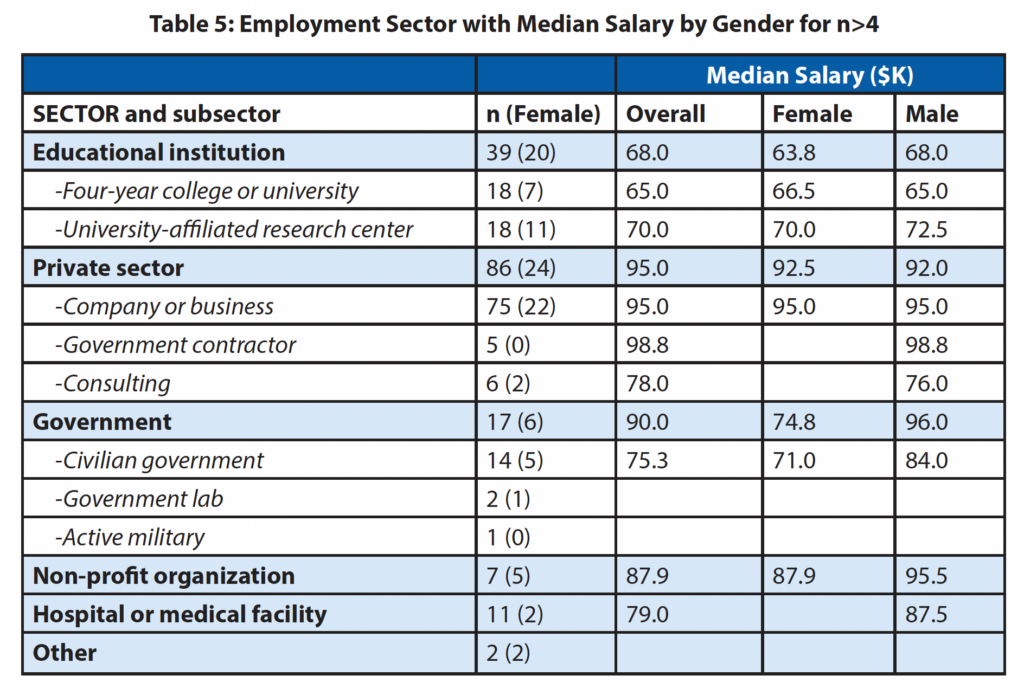
Median salaries varied substantially by state, as shown in Table 6, likely explained in part by the employment sector of the respondents in that state.
As was the case previously, numerous and diverse companies hired master’s graduates into positions with a wide assortment of job titles. For the 161 employed respondents who provided the name of their employer, there were 142 unique names. Similarly, there were more than 101 unique—although similar—job titles. The most common were data scientist (15), data analyst (13), biostatistician (9), and statistician (8).
Respondents were also asked the number of job offers they had received at the time they accepted their position. Five (2%) of the 185 respondents reported not receiving an offer (4% for class of 2020, 5% for class of 2018), 56% reported receiving one offer (2020, 51%; 2018, 49%), 30% reported receiving two offers (2020, 30%; 2018, 27%), 8.6% reported receiving three offers (2020, 10%; 2018, 13%), and 4.3% reported receiving four or more offers (2020, 5%; 2018, 4%).
For how influential graduates thought their statistics-related master’s degree was in securing their current position, 29% of respondents responded influential, with 63% reporting very influential. Forty-one percent reported being satisfied with their position (37% very satisfied); 44% with salary and benefits (23%); 41% with job security (38%); 34% with opportunity for advancement (27%); 37% with intellectual challenge (32%); and 44% with level of responsibility (30%).
Respondents’ descriptions of their job search experiences reveal several recurring themes. Many respondents highlighted the importance of networking, with connections playing a significant role in securing positions. Job boards, particularly LinkedIn and Indeed, were also common tools used in the job search process. Most respondents described long and challenging job searches, applying to hundreds of positions before landing a job, while others mentioned securing opportunities through internships or referrals. A few respondents were already employed and did not undergo an extensive job search.
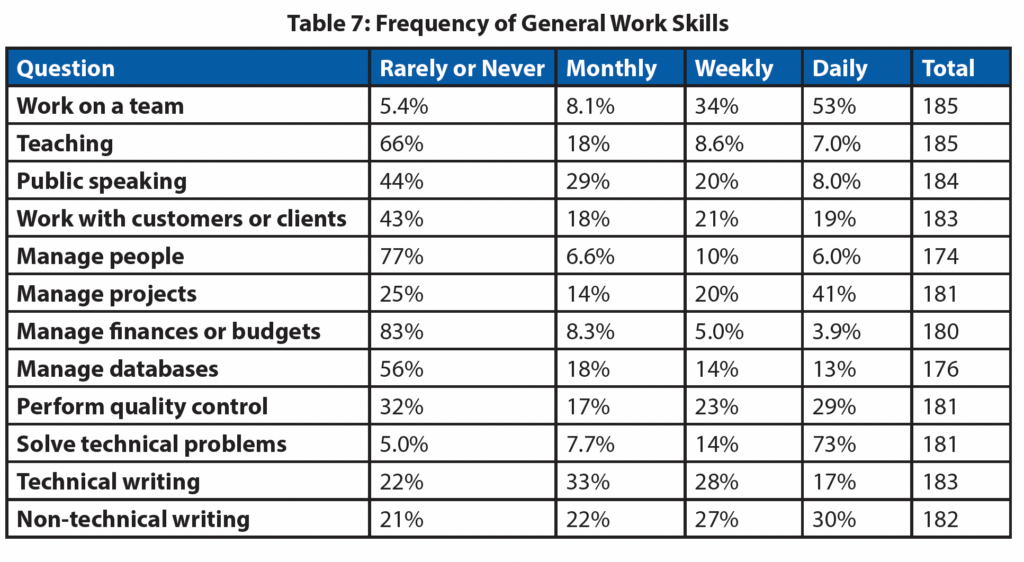
The survey sought to understand the nature of the work undertaken by master’s graduates. Seventy-three percent reported solving technical problems daily and 53% reported working on a team as often, as shown in Table 7. At least 25% of respondents reported engaging in quality control, project management, and nontechnical writing daily. One in six reported giving two formal presentations in a typical month, while two-thirds said one at most.
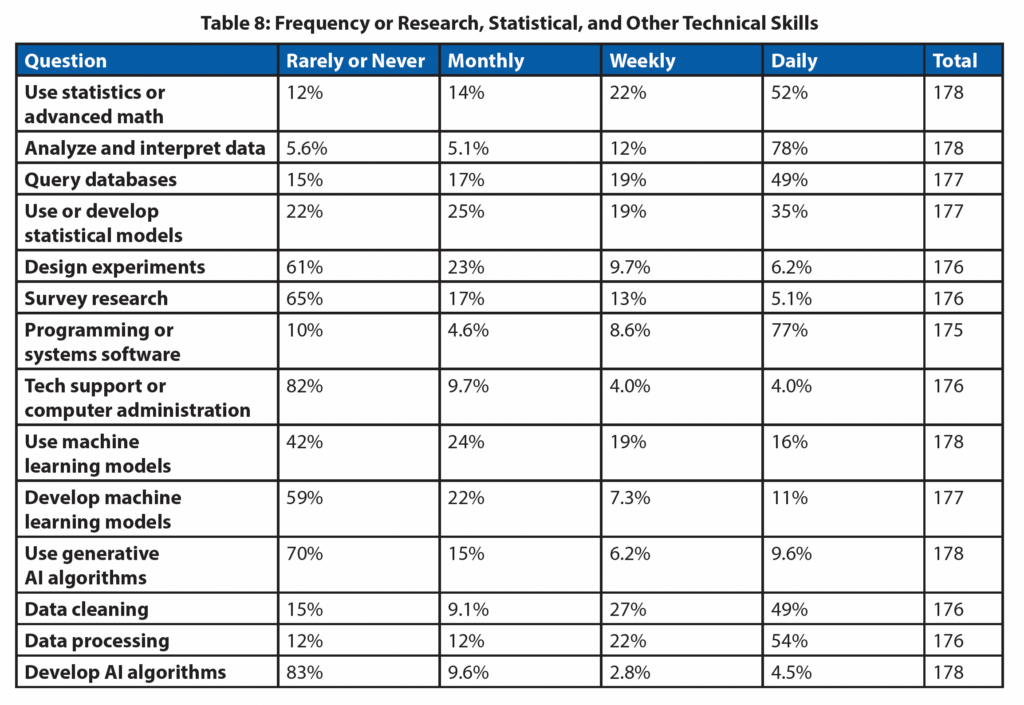
The most frequently reported technical skills being used were analyzing and interpreting data (78% daily) and programming or systems software (77%), as shown in Table 8. About half the respondents reported doing database querying, data cleaning, and data processing or used statistics or advanced math daily. The next most frequently reported skill done at least weekly was statistical model use or development at 55%. This year’s survey asked questions related to machine learning or AI for the first time. Sixteen percent of respondents reported using machine learning models daily and 11% reported developing them daily. Ten percent said they use AI generative algorithms daily and 5% reported developing AI algorithms daily.
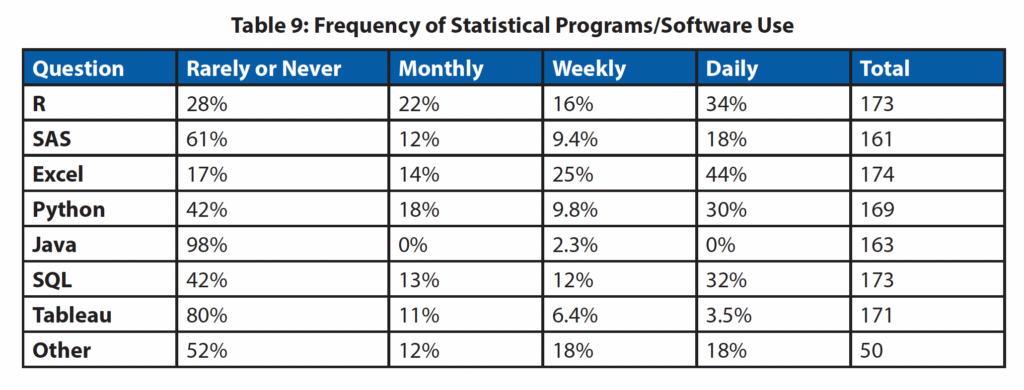
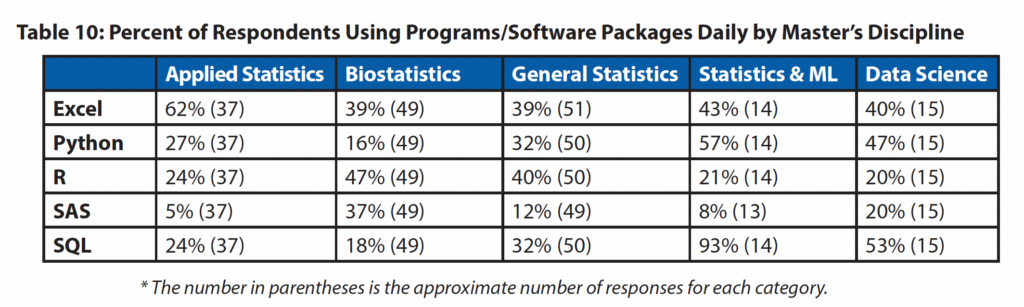
The top software programs in terms of daily use were Excel (44%), R (34%), SQL (32%), Python (30%), and SAS (18%), as shown in Table 9. For the write-ins in the “Other” category, Bash, Power BI, and STATA were each mentioned. Daily use of the top four software programs varies—sometimes widely—by master’s discipline, as shown in Table 10. Those with an applied statistics master’s specialization tended to report using Excel most often, while those with data science specializations used Python and SQL most often. Biostatistics master’s reported using SAS more often than others do.
Students
Of the graduates enrolled in a full-time degree program, 85 were in a doctorate program, five in a master’s, and five in other programs. Twenty-three of these were in a statistics program, 35 in biostatistics, and three in data science. Of the 34 in other fields of study, the following programs each had two or more respondents enrolled: education (5); computer science (2); economics (2); computer engineering (2); electrical engineering (2); logistics/management (2); medicine/nursing (2); and psychology (2). Twenty-seven of the students in a biostatistics doctoral program also earned their master’s in biostatistics, 18 for statistics.
Master’s Studies and Job Search Experiences
Respondents were generally satisfied with their master’s degree training. Ninety-three percent of respondents reported they agreed their master’s program prepared them to effectively analyze and interpret data critically using statistical models, with 57% strongly agreeing. Eighty-nine percent agreed their master’s program prepared them to effectively analyze and interpret data critically using computational methods, with 49% strongly agreeing. Eighty-one percent agreed their program prepared them to effectively communicate, both orally and in written form, results of statistical analyses to a variety of audiences, with 39% strongly agreeing.
As in past years, the responses from graduates provided in the open-ended questions are varied, insightful, and useful to current and prospective students. They can be found in the supplemental materials list.
The responses to what respondents might do differently regarding their master’s education reveal a range of perspectives. Several themes emerged across the 134 responses, including regret over not pursuing more internships, networking opportunities, or specific skill development. Many respondents expressed a desire to focus more on technical skills such as SQL, programming, and cloud certifications. Some regretted not pursuing a different field or educational track such as earning a PhD or switching majors altogether. A portion of the respondents indicated satisfaction with their choices and said they wouldn’t have changed anything.
The responses about the types of experiences, training, or qualifications that would have helped graduates secure a position reflected a strong focus on practical skills and real-world work experience. Internships were frequently mentioned, alongside a desire for more exposure to industry-relevant tools and networking opportunities. Some respondents highlighted technical skills, such as programming and data analytics, as crucial to increasing their job prospects.
The responses about additional technical or nontechnical skills regularly used in their current positions highlighted a variety of commonly used tools and skills. A significant number of respondents mentioned technical skills, including programming languages and software. Others indicated no additional skills worth noting. Project management and cloud computing also emerged as key areas for some individuals. Skills such as communication, writing, and clinical trials knowledge were mentioned but not repeated as frequently as programming skills.
The responses regarding experiences with on-campus career counseling centers reveal mixed feedback. Most respondents found the services helpful for résumé building and job search skills, but others thought the support was minimal or ineffective, particularly when it came to networking and securing job opportunities. There was a general sense that the career centers were better suited to students in certain fields, earlier in their career, or those seeking general résumé advice. A few respondents mentioned career fairs as useful, though some thought they did not lead to tangible results.
The responses about non-university programs participants engaged in demonstrate a wide range of certifications, online courses, and self-study topics. Many respondents mentioned using popular platforms such as Coursera, Udemy, DataCamp, and AWS bootcamps to enhance their data science, programming, and machine learning skills. Some pursued more formal certifications, such as SAS or actuarial examinations.
The open-ended responses regarding additional comments and advice for current students in statistics, biostatistics, or related fields centered on the importance of technical skills, internships, and long-term planning. Many respondents emphasized the need for programming proficiency and real-world experience to succeed in the job market. Others highlighted the value of pursuing internships and focusing on career goals early in their education.
Survey Administration
The American Statistical Association contracted the American Institute of Physics research team for the survey of both bachelor’s and master’s graduates in statistics and biostatistics in 2023. The ASA provided department names and contacts for the departments granting statistics or biostatistics degrees according to our records.
For the master’s graduates, the American Institute of Physics reached out to 232 departments, receiving the names and contact information for 1,921 master’s graduates who received up to four invitations to participate in the survey.
Departments that did not provide contact information for graduates were asked to distribute survey invitations to their alumni.
The survey of 2023 graduates closely followed that of the classes of 2018 and 2020.
The ASA will conduct this survey again in two to three years. Please send suggestions for improving it to ASA Director of Science Policy Steve Pierson.
Download PDF of all the tables.
Leave a Reply