
In observance of National Disability Employment Awareness Month, the Committee on Statistics and Disability wanted to recognize and celebrate the contributions of statisticians and data scientists with disabilities—not just by highlighting their lived experiences but also their professional achievements and the perspectives they bring to the field. Keep reading to get to know your colleagues better.
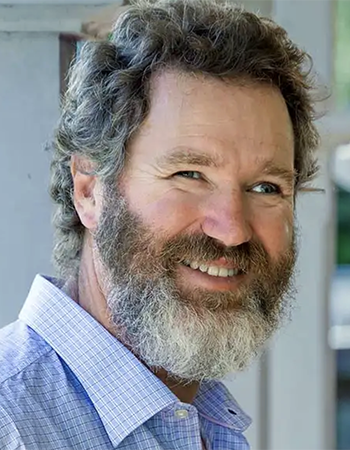
Jonathan Godfrey
Senior Lecturer in Statistics, Massey University
Where did you grow up?
In a rural area an hour south of Auckland, New Zealand. (It isn’t very rural anymore.)
Would you share information about your disability?
I am blind. The underlying medical diagnosis is retinitis pigmentosa. This is a degenerative condition that is inherited (autosomal recessive). During my compulsory years of education and through my undergraduate years, I would describe myself as half blind when talking to kids and vision impaired when a more formal term was required. The tools I used, which relied on my residual vision, became ineffective, so I was using the word “blind” to describe myself before I started my postgraduate studies.
Where did your interest in statistics/data science come from?
I was always better exercising mental reasoning in any medium other than the written word, even before it was difficult for me to keep up with the amount of time required to work with large amounts of printed text. This meant I was more successful in the subjects at high school and university where I could think without requiring visual engagement with books or blackboards. I was drawn toward statistics in part because I found the courses and staff more appealing, but given this was during my second undergraduate degree, perhaps I was a little slow to come around.
I loved solving real-world problems and discussing the world around me. That meant data and evidence, as well as the tools to work with people and their problems. Two courses in particular and one chance meeting really convinced me I had found my natural place. The courses were in experimental design and statistical consulting. I loved the idea of fractional factorial experiments and that statisticians could actually help people. I then met an American expert in statistical consulting at a conference in Australia who went out of his way to give me five minutes of his wisdom; if Doug Zahn thought I had a future, it was about time I thought I had a future and did something about it, instead of aimlessly wandering through life.
What message would you share with your younger self about life as a statistician with a disability?
If I had a time machine, I’d be able to refine which of the numerous experiments I put myself through were worthwhile and which were going to be a dead duck. There weren’t other blind people to seek advice from about accessible software and solutions to the challenges I faced, and we didn’t have the ability to find much useful information in an accessible form back then. That means my advice isn’t really advice … it’s little more than encouragement for my former self I would give. My past did teach me to be kind to my future self, though, and I regularly pass this advice on to my students today.
How has your disability affected your work as a statistician, if at all?
Being blind does mean I need to spend more energy than my colleagues finding ways to be as efficient and effective as possible. I’ve had to invest in ideas for changing workflow just so I can do my day job. I was a relatively early adopter of R markdown, and I pushed my students to use it, too. I thought they would be better off using markdown and they’d also be submitting assignments I could read, as I was against having someone read assignments aloud to me.
I’ve also got to communicate with students and clients in a way that works for me and, in my opinion, is also better for them. I’ve never had the luxury of taking a student’s mouse off them and driving their computer; we’ve had to verbalize what the students can see and need to do for themselves. My client interactions are also extremely oral interactions. It’s amazing how often a client’s spoken words differ from the way they’ve expressed their problems in an email. I also get a much better feel for their level of comfort with the statistical elements of their project when they must describe their work, not just hand over a pile of printed output.
What do you consider a great achievement?
In 2024, I was asked by the government statistician to chair the independent panel that considered options for the way New Zealand would conduct its census. My primary role was to consider the implications of the options on how disability data and evidence would continue to be collected and improved. I might have expected to be asked to work on the panel, but being asked to lead the panel was huge and, in the end, extremely rewarding.
What would you like people to know about working with others with your kind of disability?
- Get the language right as soon as you can. I dislike the term “have a disability,” as it has come from the nondisabled world trying to sugarcoat my existence. I have a dog, but I can leave him at home. I have a beard, but I can shave that off. I am blind; that’s part of who I am, and it isn’t going to change. Get comfortable with that and use the word “blind.”
- Don’t make assumptions. What is right for me may not be right for the next blind person you work with. A few simple questions might be necessary to get your curiosity out of the way, but let’s use most of the time to talk about why we’re meeting when we first meet. Take note of the fact that I am doing something and leave the questions about how I did it until we get to the social chitchat niceties at the end of the meeting time. Maybe some of the questions you thought you had will have disappeared in the meantime.
- Mistakes and a lack of knowledge are common. Neither needs to become a stressful burden. If you are unsure, ask. If you think you’ve made a mistake, ask and don’t make the apology more of a big deal than the mistake itself. Disabled people appreciate your understanding and assistance, but most of us do not really appreciate your charity because we want to be seen as your peers and colleagues, not your burden.
Is there something else you wish we’d asked?
It might be obvious, but what I do for a job. I am currently a senior lecturer in statistics at Massey University, based on the original campus in the lower North Island of New Zealand. I also do lots of work as president of Blind Citizens NZ and have a specific interest in improving the data and evidence efforts of government so we can identify and hopefully close the numerous equity gaps that exist for disabled New Zealanders.
On weekends, I like to spend time on our little farm among the animals. I probably don’t do all the jobs my sighted neighbors do, but my wife and I must work as a team to get everything done. I’m the one who plans where the fences will go and carries the heavy things. She is the one who makes sure we put the posts in the right place.
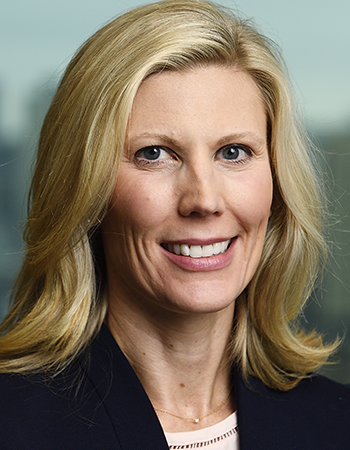
Bonnielin Swenor
Epidemiologist, Johns Hopkins University Disability Health Research Center
Where did you grow up?
I grew up in Wyomissing, a small town in Pennsylvania.
Would you share information about your disability?
I have low vision that began when I was 25 years old. My vision loss is the result of a degenerative retinal condition.
How has your disability affected your work life?
My disability has affected my work in positive ways and created challenges. My experiences as a person with a disability shape my research and provide me with an important perspective that benefits my work. However, most scientific information, data, and tools are not accessible to people with low vision or who are blind, creating formidable—yet avoidable—barriers to doing the daily work of research. I have pushed for change and found strategies that work for me, but both take time and are challenging in their own ways.
What do you consider a great achievement?
While I hope the greatest achievement of my career has yet to come, I am proud of recent national advocacy efforts I co-led, which led to the National Institutes of Health designating people with disabilities as a health disparity population and halting the US Census Bureau from making changes to disability questions on the American Community Survey.
What message would you share with your younger self about working with a disability?
Such a good question! My vision loss began suddenly and was unexpected. It occurred about a month after I had mailed in applications for graduate school. At the time, I didn’t know anyone who was blind, had low vision, or had any type of disability working as a researcher. So, I assumed it would be impossible for me to become one and I deferred going to grad school. If I could share a message with my younger self, it would be to know I was not alone and that, while the road ahead would be hard, it would be so very worth it.
What would you like people to know about working with others with your kind of disability?
I would like all researchers, data scientists, and statisticians to know that accessibility is everyone’s responsibility. From data collection and designing databases to the tools and software we use and visualizations we create, accessibility cannot be an afterthought. It is also essential to understand that accessibility isn’t just for people who are blind or have low vision. By using principles of universal design, we can make our work more accessible to all.
Is there something else you wish we’d asked?
People with disabilities are among all our colleagues, students, and the populations we serve. Considering how to include disability data and prioritize accessibility will make all our work more impactful.
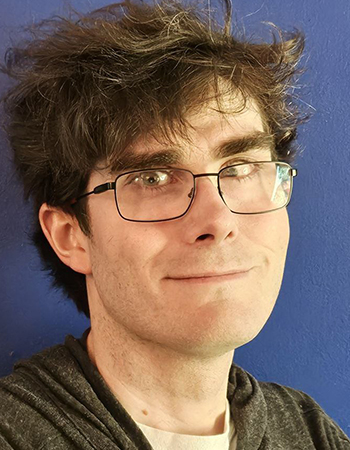
Michael Wallace
Where did you grow up?
I grew up near Oxford in the UK, before moving to study in Cambridge and then London. Shortly after completing my PhD in 2012, I emigrated to Canada to take up a postdoc at McGill and have been a professor at the University of Waterloo since 2016.
Would you share information about your disability?
I was born with a fairly rare genetic condition whose myriad consequences include a severe visual impairment. I have some useful vision in one eye but am considered legally blind in Canada. Describing vision loss can be pretty tricky, so I try to explain it through examples. For instance, I generally can’t recognize people—even close friends—by sight from more than a couple feet. And if you’re giving a presentation, I won’t be able to read your slides, even if I’m in the front row. On the other hand, I can still get around by myself (at least in the daytime), although it can take me a while to get around in unfamiliar places.
Where did your interest in statistics/data science come from?
I’ve been interested in math and numbers for as long as I can remember! In fact, one of my earliest memories of math was a result of my eyesight, playing counting games designed to help improve my hand-eye coordination. That said, I didn’t become interested in statistics specifically until my undergraduate degree. When I started, I thought I wanted to focus on pure math, but I was gradually drawn in by how statistics offered a way to integrate math into real-world problems. Statistics requires a unique blend of math, critical thinking, problem solving, creativity, and communication—all of which I really enjoy.
What message would you share with your younger self about life as a statistician with a disability?
It’s pretty good! There are a lot of things that are either much more difficult or simply impossible for me to do because of my eyesight, and so there are a lot of careers that aren’t particularly viable. However, being a statistician—and especially an academic—has worked out pretty well.
Much of what I do is in my head, on a computer, or talking with collaborators and students, so while there are still a lot of challenges that result from my eyesight, it’s not exactly a career that’s reliant on good vision. There’s also a lot of autonomy and flexibility both in the type of work I do and how and when I get work done.
Flexibility can be especially important when living with a disability; I have a lot of medical appointments and procedures, and sometimes my eyes just have ‘bad days’ unexpectedly. Being able to adapt my workload to accommodate those types of disruptions makes life a lot easier than a more traditional 9-to-5.
How has your disability affected your work as a statistician, if at all?
Somewhat by fortune, somewhat by design, I can carry out much of my work without my eyesight being too much of an issue. With much of what I do being on a computer, I’m able to take advantage of technology to help get things done (although I’m definitely a lot slower than I’d like when it comes to reading, and statisticians do a lot of reading).
The main challenges arise in ‘real-world’ situations such as teaching, presenting, and attending conferences. When teaching or presenting, I can’t ‘read the room’ based on visual cues, which can make it tricky to know if an explanation has landed or if I need to adapt to better engage the audience. I also can’t easily refer to notes (or even my own slides), so I do a lot of preparation for my classes and talks to get as much as possible ‘in my head’ so I’m not reliant on any visual references.
Meetings and conferences present challenges, too. Travel is tricky, especially navigating new cities and venues. Networking also takes on quite a different form when you can’t recognize faces or read name badges, so I generally try to set up conversations in advance. I can’t rely on spotting someone I want to talk to at a welcome reception or coffee break!
What do you consider a great achievement?
I realize it will mean absolutely nothing to almost everyone who reads this but, many years ago, I was part of a team that won a British TV quiz show called Only Connect. It’s got nothing to do with statistics but it’s very high up on my personal list of achievements!
On a more serious note, being able to demonstrate to my students that someone with my degree of sight loss can succeed in academia and research has been very rewarding. I’ve taught thousands of students over the years, many of whom live with their own disabilities, and many of them have been kind enough to let me know I’ve helped encourage them to succeed despite potential obstacles, and that’s always fantastic to hear.
What would you like people to know about working with others with your kind of disability?
At a very general level, I think a good principle to keep in mind is that if you’re making something more accessible to someone with vision loss (or any other kind of disability), you’re usually making it more accessible for others, too. Whether you’re circulating meeting materials in advance, offering flexibility in how meetings are conducted (in person, online, hybrid), or incorporating visual clarity into documents, these are all steps that help those with and without vision loss alike.
While I certainly can’t speak for every person with vision loss, my general request to others is to ask before trying to help! While I know actions are always well-intentioned, it can be very difficult to intuit what I can or can’t do or what help I do or don’t need, and sometimes someone might do something they think is helpful that, in fact, makes things more difficult for me. It’s also important to remember that someone with vision loss may not want it to be ‘obvious’ (many of my friends and colleagues have been surprised to learn quite how bad my eyesight is), so you may want to consider approaching this kind of thing on a one-to-one level.
As for something a little more specific, please introduce yourself! Something I think is easy to forget when working with people with limited eyesight is we often can’t identify you by sight alone, even if we know you well. A simple, “Hi Michael, it’s [your name here],” is a huge help to someone like me. I know it can sometimes feel a bit unnecessary (especially if you’re wearing a name badge), but it’s something I always appreciate.
Chuck Coleman
Where did you grow up?
I grew up mostly in Arlington, Virginia, with brief sojourns in Israel and Portland, Oregon.
Would you share information about your disability?
I’m autistic and have ADHD and two other mild neurodivergences.
Where did your interest in statistics/data science come from?
While I took the mathematical versions of probability and statistics in my first two years of college, respectively, it didn’t really start until I took both the graduate econometrics classes when I was a senior. I also became very close to my professor.
What message would you share with your younger self about life as a statistician with a disability?
It’s not so much that I want to convey a message, but, rather, I would have been much better off with a diagnosis. As I was growing up, my autism was interpreted as a bundle of quirks and character flaws. People were unable to understand my cognition was very different from theirs. In retrospect, it seems other autistics and I were more understanding of each other than the general population.
How has your disability affected your work as a statistician, if at all?
If anything, it has been a benefit. My hyperlexia—unusual facility with languages—made learning computer languages easier. My interest in ground truth allows me to understand representations as such and to translate between different kinds of representations.
What do you consider a great achievement?
My greatest intellectual achievement is writing my dissertation in economics. More important, I have managed to raise two children who are now happy, successful, moral adults.
What would you like people to know about working with others with your kind of disability?
Don’t fear people who think and behave differently. They often have valuable insights as a result of being different. That goes for everyone. We’re all different, with different perspectives, preferences, abilities, and other strengths and weaknesses. Seek out and include people who are different in your personal and professional lives. You don’t have to become great friends to learn from anyone else. Diverse teams have been shown to perform better in the workplace so long as they accept each other as they are. Even your enemies can teach you if you listen carefully.
Is there something else you wish we’d asked?
Thanks for the curveball! I think finding resources about disabilities in general and in particular is important. In the case of autism, you really need to rely on us for guidance, whether as individuals or in autistic-run organizations. Some people and organizations are stuck in the medical paradigm, where autism is a defect that needs to be treated or, better, eradicated. Most of us prefer the difference paradigm, which accepts autism for what it is, includes autistics, and seeks to improve autistics’ quality of life, which benefits everyone.
I just read Disability Insights on the American Statistical Association Magazine blog and I appreciate how clearly and thoughtfully you explain that numbers and data can tell powerful stories about disability and inclusion, because you show that looking beyond averages and percentages helps us understand the real experiences of people with disabilities in education, employment, health, and community life. Your article reminds us that good data can reveal gaps, highlight progress, and support better decision‑making by policymakers, researchers, and advocates who want to create fairer systems. By showing why rigorous, compassionate analysis matters, you help readers see that statistics are not just abstract figures but tools that can support dignity, equity, and meaningful change.