

Danijela Markovic and Oskar Kärcher
Ask most universities what data literacy means and you will get a list of technical skills such as collecting, preparing, and analyzing data. These things matter. But scroll through job postings requiring data skills and a different picture emerges. Employers are looking for skills such as agility, problem solving under tight deadlines, prioritizing, creative thinking under pressure, collaborating within teams, and clearly communicating the story behind the numbers. These foundational skills are absent from most data science curricula.
There is an equally pressing challenge: the incredible variety of learners in the classroom. Students arrive with a wide range of experiences, backgrounds, interests, and commitments, and some struggle to focus due to sensory factors in the physical environment. Not everyone pursuing data science comes from a STEM background, and a one-size-fits-all approach to data literacy education can unintentionally shut out the very people who could benefit the most. When someone who does not feel comfortable with mathematics is told they need to learn a programming language before they can do anything meaningful with data, they might simply walk away. That is a loss for both students and organizations, which desperately need people who can understand the human context behind data.
Living Tree
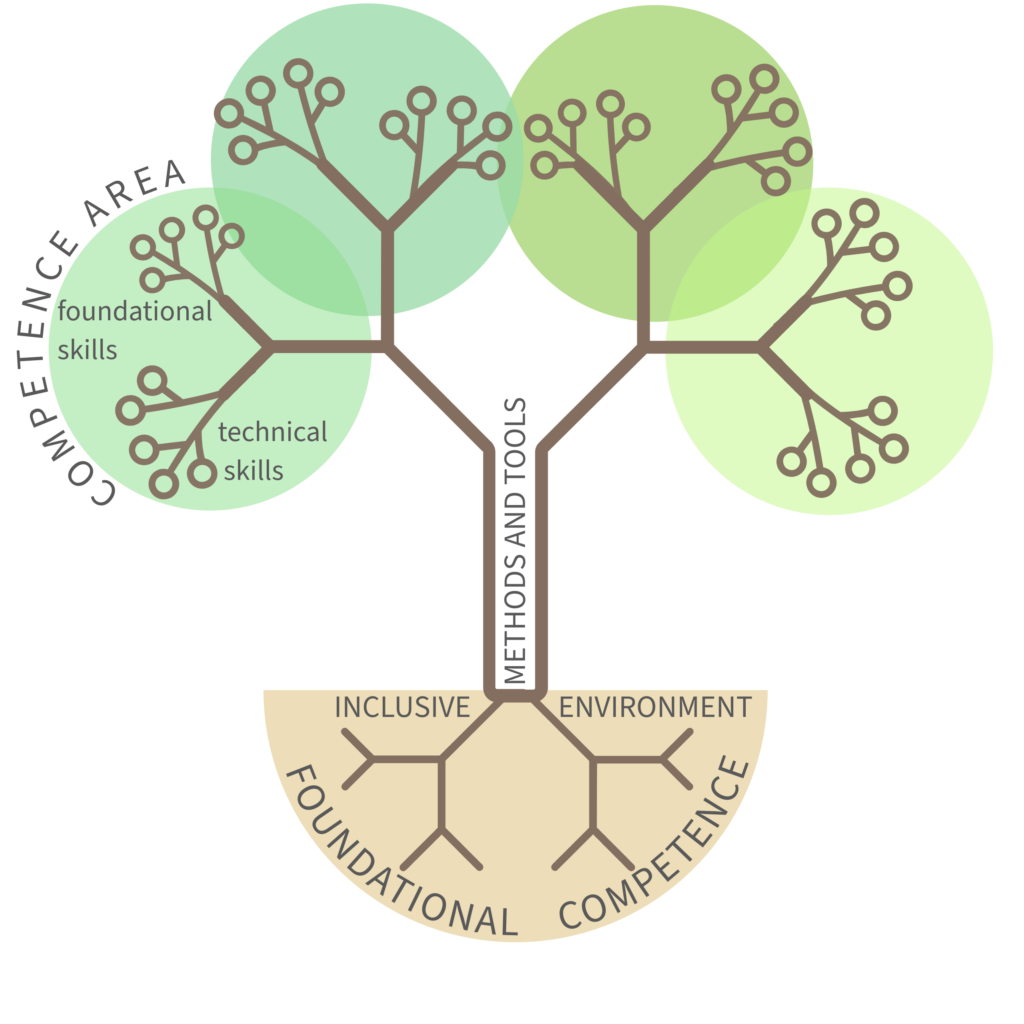
The data literacy education framework we developed uses the metaphor of a living tree to capture how all its elements depend on each other. The soil is an inclusive environment that genuinely accommodates different backgrounds and personal traits of students such as motivators, learning styles, goals, and sensitivity. The roots symbolize foundational competence—the complex thinking skills that make everything else possible. The trunk represents teaching methods and tools. The branches are the specific competence areas: data collection, analysis, modeling, visualization, and storytelling.
Cut the roots and the tree dies. Poison the soil and nothing grows. It sounds obvious when stated this way, yet most curricula focus almost exclusively on the branches.
Kärcher.
Solving real-world data problems requires, at its core, the right mindset. We focus on six key complex thinking dimensions: scientific; systems; computational; critical; creative; and ethical. We don’t treat these as isolated categories. For example, a business management student who worked at an agricultural machinery plant was interested in modeling wheat yield. Our group discussions highlighted the need for a range of considerations such as scientific thinking (What other data are needed?), critical thinking (Where are potential biases?), and ethical thinking (Whose interests does this model serve?).
Experience First, Theory Second
As students, we were always taught the theory first and only rarely had the chance to apply it. As instructors, we do the opposite. We begin our class sessions with a real-world scenario, presenting a tangible data problem that we, or a prepared student, attempt to solve using our web application, STATY. Only then do we introduce the mathematical-statistical foundations of those algorithms. To encourage active learning, students then apply these algorithms independently or in groups using either their own or provided datasets. They face obstacles and make mistakes with real consequences, motivating them to understand the why behind the process.
STATY is a free, primarily Python-based open-source web app we designed to bridge the gap between theory and practice. Its intuitive interface guides users through the entire analytical workflow—from uploading raw data to training machine learning models—without requiring any programming. However, tools alone do not make learning happen.
Coaching, Not Just Teaching
Another pillar of our approach is coaching. This might sound like a buzzword, but we mean something specific. Rather than standing at the front of the room and delivering knowledge, we spend a significant portion of class time asking questions and helping students unstick themselves. Coaching sessions use structured questions and agile principles to help teams plan their projects, navigate disagreements, and stay adaptable when their original question turns out to be unanswerable with the data they collected. Lectures are held online, which simplifies real-time progress monitoring through quizzes and the “secret chat” (anonymous questions via the online conferencing tool). To support focus, students can request breaks at any time.
Data literacy is rapidly becoming a civic skill, not just a professional one. Yet many data education efforts still concentrate their energy almost entirely on technical (digital) skills.
(Directed) Autonomy in Practice
Imagine a business data science course with 20–25 master’s management students, at most one or two of whom have any programming experience and virtually none with any predictive modeling experience beyond multiple linear regression. Over 14–15 weeks, roughly half the time is devoted to theory, while the rest is hands-on practice. Topics move from exploratory data analysis and feature engineering through various regression, classification, clustering, and text mining algorithms, with a brief dip into Python along the way.
Our summative assessment asks students to write two research papers: a group project and an individual one, each using self-collected data, with at least one working predictive model required across the two. They have complete autonomy in selecting software and can even opt for zero programming. Our goal is to empower them with options, not obligations. Regardless of the path they choose, the practical reality remains: Preparing the data itself usually takes up most of the allotted time.
Across past cohorts, the depth of the students’ work has exceeded our expectations. One student’s individual paper even identified an error in a published scientific study, proving the value of rigorous, critical analysis.
What We Learned
Within the first application of our framework, not everything worked as planned. Even with a student teaching assistant available to help, setting up Python environments on personal computers was challenging. We have since moved to video tutorials and a portable version of STATY, and the difference has been dramatic.
Students also struggled with the freedom to choose their own datasets for group projects. We are therefore planning to offer curated datasets as an option for group projects, though not for individual ones.
The emotional dimension of this work is also real. Students regularly feel overwhelmed, especially when they encounter a concept that refuses to click on first contact. We started drawing an analogy to sport. In sport, that feeling of struggling at the edge of your ability is precisely where growth happens. Sitting with discomfort, rather than retreating, is a skill data professionals need as much as any technical ability.
Student software preferences revealed something we found genuinely interesting: Even when programming was required for the top grade, most preferred not to use it, although they all successfully completed in-class Python exercises. This appears to reflect how adults decide to allocate their limited time and energy, rather than being a failure of the curriculum. When given autonomy, people make pragmatic choices; our job is to ensure those choices are informed.
Beyond the Tree
Data literacy is rapidly becoming a civic skill, not just a professional one. Yet many data education efforts still concentrate their energy almost entirely on technical (digital) skills. Our experience is limited, but what we have seen so far suggests that, with the appropriate tools, the appropriate pedagogy, and genuine attention to who is sitting in the room and what they care about, it is possible to engage students from across the academic spectrum in serious, rigorous data work, thus enabling them to practice both technical and foundational data literacy skills.
To learn more, read “Toward a Holistic Approach to Data Literacy Education: A Framework and Implementation in a Data Science Course for Business Management Students” by Markovic and Kärcher.
Leave a Reply