Counting Statisticians: How Many of Us Are There?
Keith Crank, ASA Research and Graduate Education Manager
Keith Crank has a BS in mathematics education and an MS in mathematics from Michigan State University and a PhD in statistics from Purdue University. Prior to joining the ASA as research and graduate education manager, he was a program officer at the National Science Foundation, primarily in the probability program.
In November I wrote about the problem I’ve had in determining the number of PhDs awarded in biostatistics in the United States. Since then I’ve been asked how many biostatisticians there are worldwide and how many statisticians there are working in the United States. I don’t see a good way to answer either of these last two questions, except to say I don’t know.
Of course, the first issue to resolve is whom to classify as a statistician or a biostatistician. The Bureau of Labor Statistics (BLS) publishes wage information by occupation. According to BLS, in May 2008 there were about 20,000 statisticians in the U.S. workforce. The BLS includes biostatisticians in the statistician category, but it does not include statistics/biostatistics faculty at colleges and universities. Nor does it include managers. Granted, these classifications make sense for BLS, since the data are used for salary comparisons. But they don’t help much in estimating the number of people in our discipline.
Lacking a direct method of estimating the number of statisticians, is there an indirect method that might provide reasonably good estimates? For example, can we estimate the number of statistics faculty and the number of managers who are statisticians? Counting statistics faculty in statistics and biostatistics departments is probably doable, but what about statistics faculty in other departments? And estimating the number of statisticians in management (or other) positions also appears to be problematic.
What about approaching this from the supply side? Can we count the number of people getting statistics/biostatistics degrees and go from there? There are obvious problems with this approach. What about migration—between countries and between disciplines? How do we adjust the number of master’s degrees to account for students who go on for the PhD? Can we account for people who die, retire, or leave the workforce for other reasons?
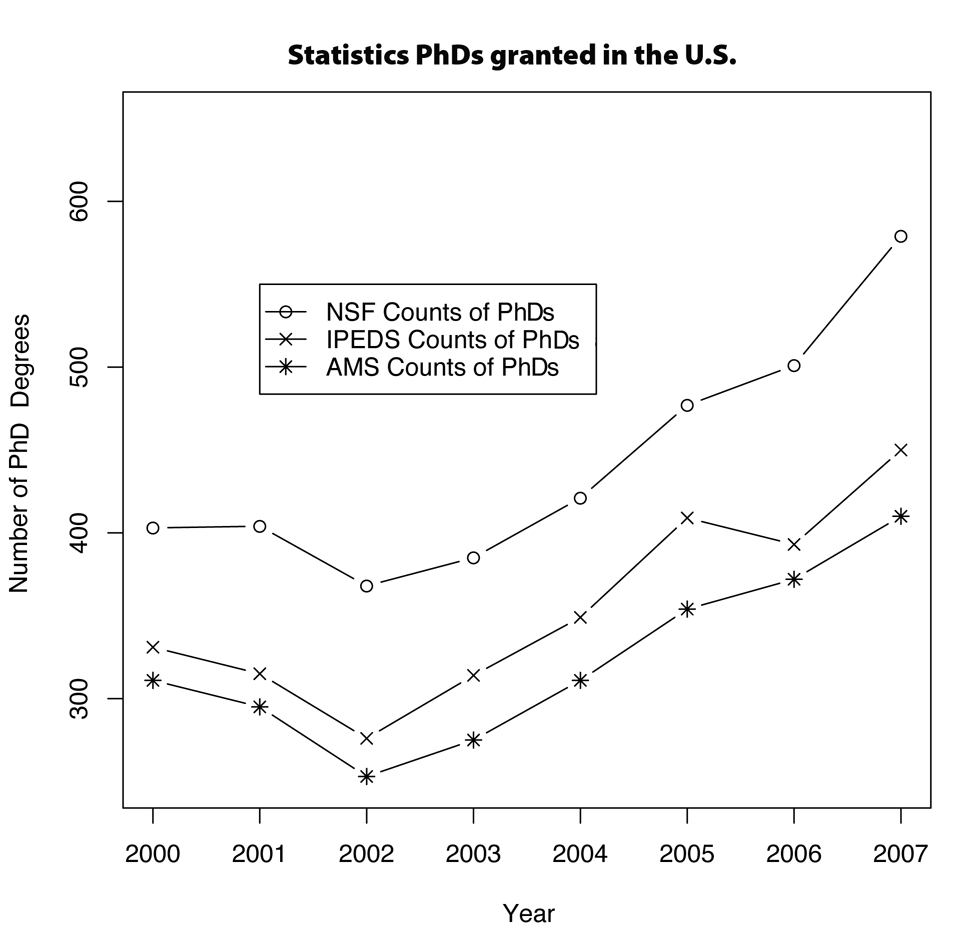
Figure 1. At the PhD level there are at least three sources that attempt to count the number of PhDs in statistics and biostatistics from U.S. institutions.
These are obvious issues, but even counting the number of degrees (bachelor’s, master’s, and PhD) is not easy. At the PhD level there are at least three sources that attempt to count the number of PhDs in statistics and biostatistics from U.S. institutions. Although this seems like a fairly straightforward thing to do, the three sources give different numbers (see Figure 1). (When I say this is seemingly straightforward, I mean that the Integrated Postsecondary Education Data System (IPEDS) data from the Department of Education and the National Science Foundation (NSF) data are based on a complete enumeration with near 100% response rates. The difference between them is that IPEDS data comes from the institution and NSF data comes from the individual degree recipients.)
The American Mathematical Society (AMS) numbers are lower than both the NSF and IPEDS numbers. This happens for two reasons. First, AMS has lower response rates, and it does not try to adjust for nonresponse. (AMS simply totals up the counts it receives. It does not try to estimate the number of degrees from departments that do not respond.) Second, NSF and IPEDS have multiple categories for statistics, including mathematical statistics, general statistics, biostatistics, biometrics, business statistics, educational statistics, and social science statistics.
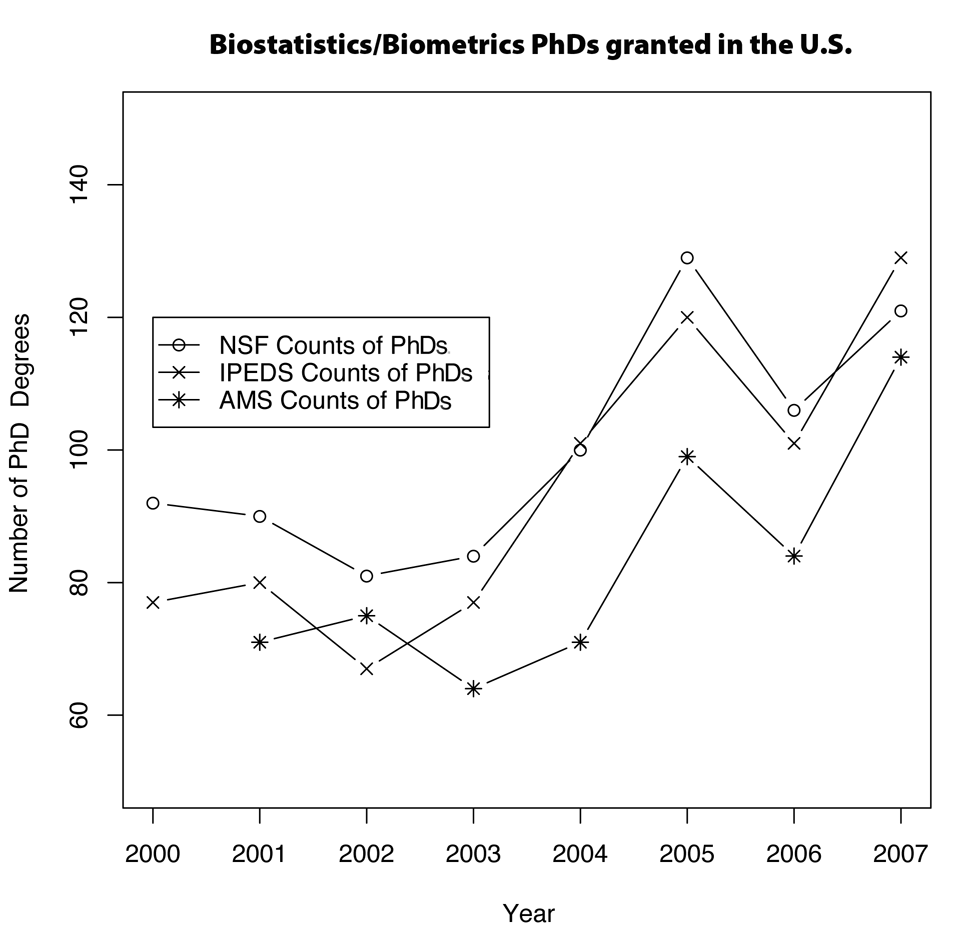
Figure 2. Biostatistics/biometrics counts for 2000-2007
If we restrict our categories to mathematical statistics, general statistics, biostatistics, and biometrics, the numbers are in closer agreement. Figure 2 is a graph of the biostatistics/biometrics counts for 2000–2007. Here the lower AMS figures can reasonably be attributed to nonresponse, and everything looks good, at least on the surface (but see my November 2009 article in Amstat News for concerns about these numbers). Figure 3 is a graph of the mathematical/general statistics counts. As with the biostatistics/biometrics degrees, there is general agreement between the three sets of data. But if there is an issue of undercoverage in the AMS data, one wonders why the NSF and IPEDS numbers aren’t higher. (Note: The 2007 number from NSF is substantially higher than the other two and may be reasonably accurate.)
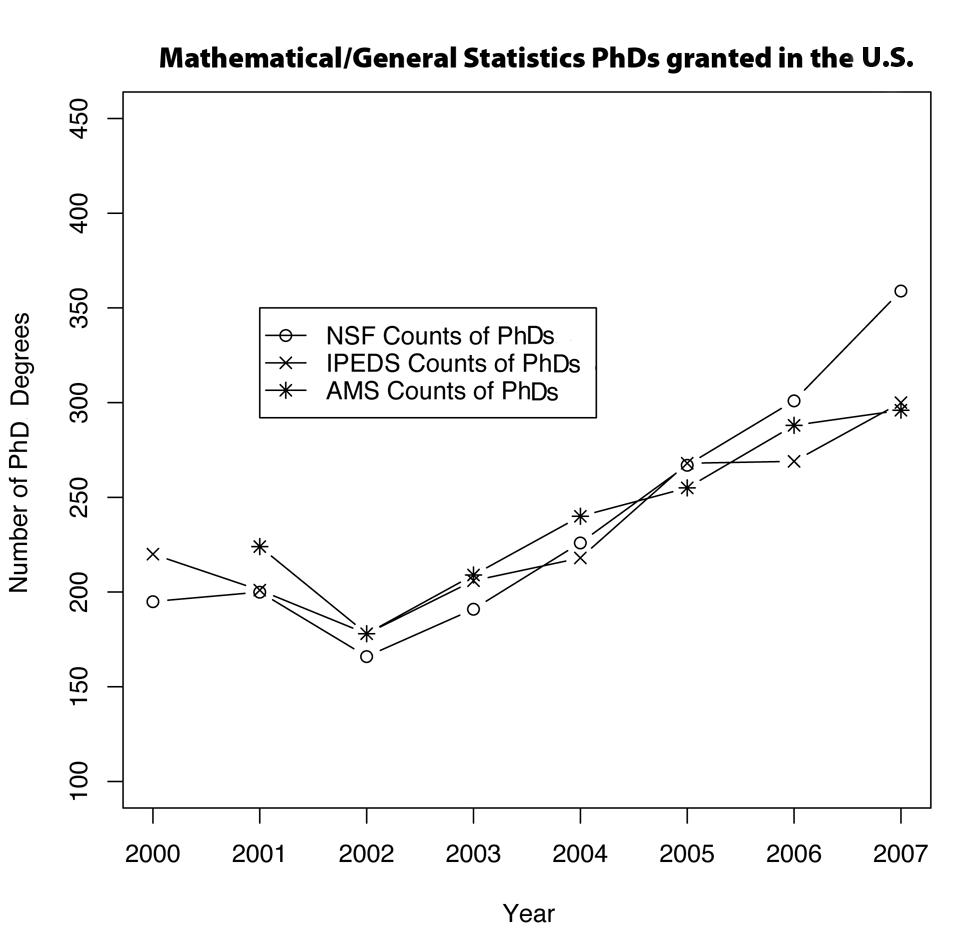
Figure 3. Mathematical/general statistics counts
In conclusion, I don’t know how many statisticians there are. If anyone has ideas on this matter, please let me know. But, for now, if I am asked how many of us there are, my response will have to be, “Given the high demand and low unemployment, evidently there are not enough.”
To contact me, send an email to keith@amstat.org. Questions or comments about this article, as well as suggestions for future articles, are always welcome.


 (No Ratings Yet)


