

Amos Jeng, University of Michigan, and V. N. Vimal Rao, University of Illinois
Generative AI technologies have changed the world. In education, some studies show positive effects of AI on students’ learning, primarily via self-regulated learning strategies. The story is not all roses, however, as other studies note potential harmful effects of these technologies, including the risk that students offload their thinking to AI and subsequently fail to develop critical thinking skills.
One tool that has stood out to us in the landscape of generative AI workflows is Rtutor.AI, developed by Orditus. RTutor.AI is a web-based R Shiny app that translates plain-language statistical requests into R code using large language models. Unlike general-purpose AI tools (e.g., ChatGPT, Copilot, Gemini, or Claude), Rtutor.AI users type a prompt tantamount to pseudocode and receive executable R code together with its output.
This means users are unable to simply upload a dataset and ask Rtutor.AI to analyze it for them—Rtutor.AI’s main function is to translate plain-language requests into R code, not to generate code for anything outside of that request. In other words, Rtutor.AI constrains the power of generative AI, forcing students to think about what they want to analyze and how the analysis should be done. In some ways, Rtutor.AI can be construed as a high-powered calculator.
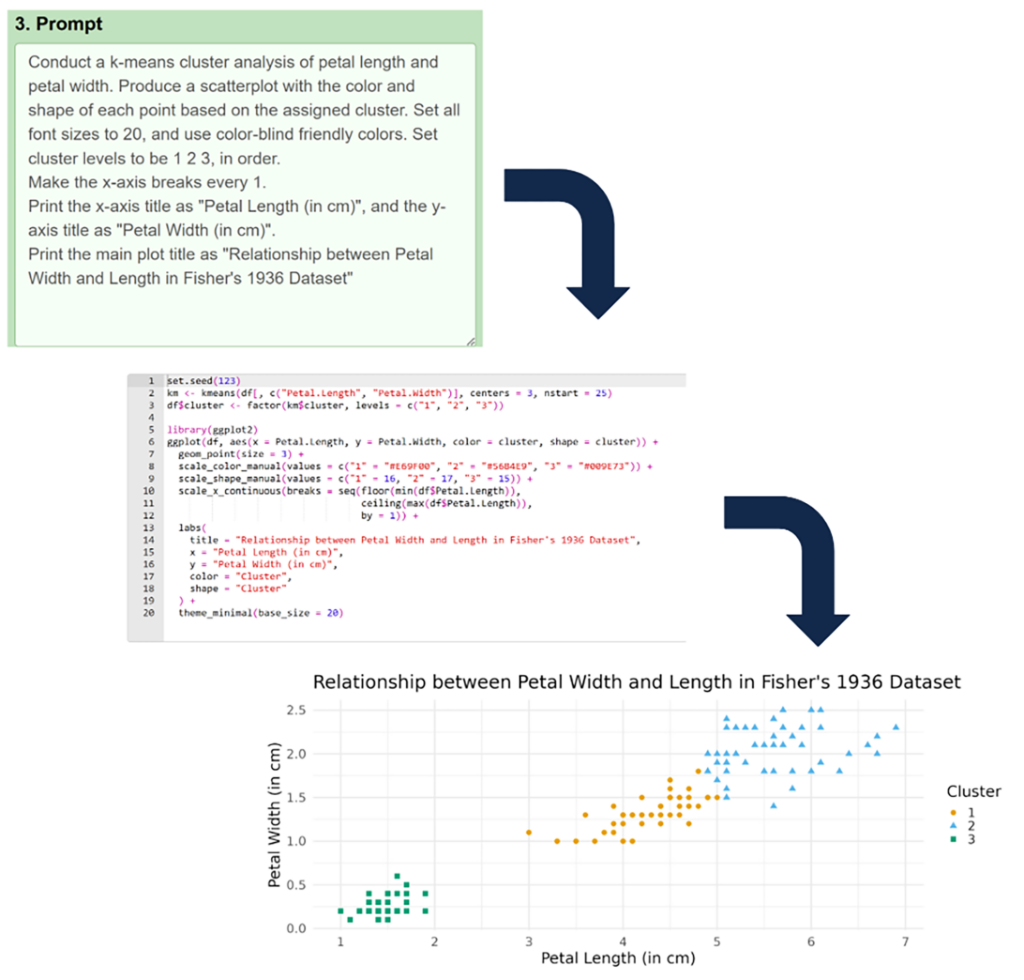
We began incorporating Rtutor.AI into our courses in the spring 2024 term but have simultaneously worked to systematically study and evaluate its use in supporting statistics learning. To wit, we first set to capture an empirical trace of students’ thinking when using Rtutor.AI. This first set of results, published in a recent Journal of Statistics and Data Science Education article titled “Students’ Statistical Thinking When Using Generative AI: A Descriptive Case Study,” focuses on the following research question: What is students’ statistical thinking when using Rtutor.AI to create and interpret multivariable scatterplots?
Key Findings
To answer these questions, we conducted a multiple descriptive case study in which five undergraduate students who had previously taken an introductory statistics course completed a graphing task with the help of Rtutor.AI. We gave each participant a dataset containing information about a sample of high school students’ study hours, ACT scores, and school names across three high schools. The participants’ task was to use Rtutor.AI to create a multivariable scatter plot with trendlines and interpret the visualization to recommend which high school a student should attend. During the task, we had participants voice their thoughts out loud to a member of the research team, which gave us insight into their statistical thinking. We then analyzed interview transcripts and data artifacts to extract common themes to describe students’ statistical thinking.
Lowering Barriers to Completion of Statistical Tasks
Participants generally found that the intuitive nature of prompting with AI reduced technical and procedural barriers to statistical problem-solving, which allowed them to focus more easily on completing the graphing task. For example, one participant, Abi, emphasized how Rtutor.AI simplified the process of translating their statistical plan to a visualization:
You have to be a little bit careful about how you say stuff, but for the most part, you can just tell it what you want it to do, and it’ll do it.
However, Rtutor.AI does not completely abstain from automating key aspects of the graphing process, and in doing so may have also reduced opportunities for deeper engagement in statistical thinking compared to traditional programming tasks. For example, one participant, Bo, noted that Rtutor.AI did a lot of work on their behalf:
It kind of gives me the elements, like hours spent preparing and ACT scores, without me asking, based on the dataset that we uploaded. And then it kind of gives me a key to what schools are recommended based on hours spent studying and their ACT score. … Yeah, it kind of did the first step for me.
This tradeoff between ease of use versus prerequisite thinking and planning is a key concern with the adoption of AI tools.
Prior Knowledge and Preferences Shaping Engagement with AI
Students’ pre-existing statistical knowledge and graphing preferences shaped their engagement with Rtutor.AI. For example, Bennu structured their first prompt around core graphing elements, including the graph, x-axis, and y-axis variables (“Create a multivariate scatter plot with x-axis as number of hours of studying and y-axis as ACT score.”). When asked about this choice, Bennu explained that they had been taught to always start the graphing process by identifying the axes in this way:
I feel like the first thing that you want to know is what data you’re getting, and that is the X and the Y. So, for me, that’s always been the first obvious step to look at and put on my piece of paper, my computer. … In my mind, that’s what I’ve been conditioned, either by myself or by school, to do.
Thus, Bennu entered the task with a pre-existing understanding of the appropriate steps involved in graphing, and that understanding, in turn, shaped their structured approach to using Rtutor.AI.
In contrast, Bo did not frame their initial prompt around graph components; they simply asked Rtutor.AI to “create a multivariate scatterplot.” When asked what they expected to see, they responded:
I have no idea [what I’ll see when I click submit]. Maybe just a scatterplot?
This suggests that because Bo entered the task with a less developed understanding of graphing conventions, they defaulted to a more open-ended, trial-and-error approach. While Bo was ultimately able to complete the task, it took them longer, and they spent a lot of time jogging their memory based on Rtutor.AI’s output to figure out what to do and look for.
We think this finding highlights a strength of Rtutor.AI: It might still provide some output, but without a solid statistical understanding, students were unable to make informed statistical decisions. In effect, a lack of understanding turns Rtutor.AI into a fancy calculator. Without knowing how to use it and why, its usefulness diminishes.
Implications
How do these results help inform instructional choices about AI’s incorporation into statistics and data science courses? Most importantly, we found students lacking a strong statistical understanding struggled to use Rtutor.AI to generate and interpret graphs effectively, demonstrating that Rtutor.AI could not completely compensate for this lack of prior statistical knowledge. We think this is a strength of Rtutor.AI compared to general-purpose AI tools; we do not want our students to be able to offload their statistical thinking to AI software tools.
For students with a solid baseline understanding of the statistical ideas at play (received from the normal course of instruction), Rtutor.AI supported continuous metacognition and self-reflection, in which students thought about whether the output generated by their prompts “made sense” and aligned with their goals and expectations. Even more so, the fact that it was prompts and not programming syntax might have facilitated students making connections between statistical concepts and vocabulary. Additionally, by lowering barriers to statistical problem-solving, Rtutor.AI allowed these students to spend more time focused on the graph and statistical implications of the results presented therein.
As educators, our choices regarding the incorporation of AI-based tools into our classrooms is not limited to a dichotomy. There is a middle ground in which we automate what we don’t want our students to focus on, leaving more time for what we do want them to focus on. Doing so may strike an ideal balance to ensure our students focus on our key learning objective: critical thinking in a statistical world.
Rtutor.AI Has Evolved
This study evaluated Rtutor.AI version 1.0. Since the research was conducted, the authors have collaborated with Orditus to redesign Rtutor.AI’s workflow and features specifically for classroom use.
Read the complete study in the Journal of Statistics and Data Science Education.

Amos Jeng

The importance of this research is that it frames AI as a tool – not as an alternative. This is key to framing our questions of discovery.