Forecasting Citrus Production in Florida
Jeff Geuder, USDA/NASS – Florida Field Office Director
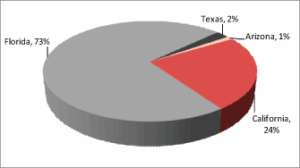
During the last decade, nearly three quarters of all U.S. citrus was grown in Florida (Figure 1). The relative size of the Florida citrus crop demands that statistically accurate forecasts be made starting in October of each year and continuing throughout the marketing year. To provide these statistically accurate forecasts, NASS developed a survey program based on objective counts and measurements, rather than subjective reporting from individual producers.
There are four basic components of the citrus production forecast:
- number of bearing trees
- average number of fruit per tree
- average fruit size
- fruit loss from droppage
NASS conducts a series of surveys to estimate each of these components.
Commercial Tree Inventory: The commercial tree inventory is conducted every year to provide an estimate of the number of bearing trees. It also provides a sampling frame for the objective measurement surveys (described below). Digitized grove boundaries are used to generate maps, which field crews use to check for changes from the previous tree inventory, typically old trees being removed or new trees being planted. The resulting database consists of every block of citrus in the state, with information about size, location, variety of fruit, and age of the trees.
Survey to Estimate Fruit per Tree: Another survey is conducted every year in August and September to provide an estimate of the average number of fruit per tree. A stratified sample of more than 3,200 groves is selected from the tree inventory database. Survey crews visit each selected grove and use a random selection process to select two trees within the grove. On each selected tree, a sample order ativan no prescription limb representing approximately 10% of the bearing surface of each tree is randomly selected. Fruit is then counted on this sample limb, and the fruit counts are expanded by the reciprocal of the probability of selection to provide an estimate of the total number of fruit on the tree.
Survey to Estimate Fruit Size: Citrus fruit size varies from season to season, depending on weather and cultural practices. A fruit size survey is conducted monthly, starting in September and continuing throughout the season, using a stratified sample of approximately 1,800 groves selected from the tree inventory database. Field crews randomly select two trees in each of the sample groves and randomly select a limb to measure the size of each piece of fruit on the limbs. NASS uses a 10-year regression model to project each month’s survey measurements to final size at harvest.
Survey to Estimate Fruit Loss: A certain amount of fruit drops off citrus trees during a growing season. Since the initial estimate of fruit per tree is made in late summer, NASS conducts a monthly survey to track the drop rate throughout the year. Using the same sample of 1,800 groves, field crews randomly select trees and branches for this survey. Beginning in September and then at monthly intervals, fruit on the sample branches are counted. NASS uses a 10-year regression model to project each month’s survey measurements to final drop at harvest.
Accuracy of Monthly Forecasts
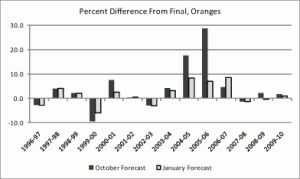
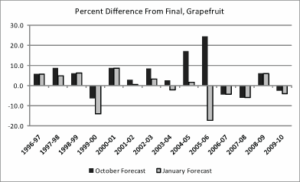
Several factors influence the accuracy of the monthly production forecasts. Weather events (such as hurricanes and freezes) have a significant effect on the final production of citrus each year. Figure 2 shows the how the October and January forecasts for oranges compare to the final production over the past 10 seasons. Figure 3 shows the same data for grapefruit. In most seasons, the October forecast is within 5%–10% of the final production. The notable exceptions are two seasons affected by hurricanes (2004–2005 and 2005–2006) and a season in which there was a record low loss due to fruit drop (1999–2000).


