
Robert Starbuck
The 2012 ASA Fellow awards were presented recently at JSM in San Diego, California. Here, I present a brief update to previous articles about this award appearing in Amstat News.
Employment Sector
In the range of years shown, the percentages of ASA members by employment sector have remained relatively stable: 42% Academe, 47% Business/Industry, and 11% Government.
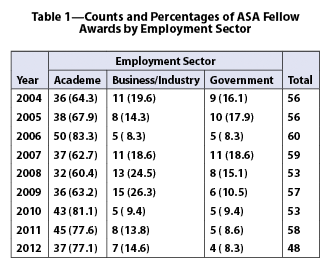
The counts of ASA Fellow awards given by employment sector since 2004 are presented in Table 1 and Figure 1.


The percentages of Fellows awarded by employment sector relative to the percentages of ASA membership by sector are shown in Figure 2.

The counts and percentages of Fellow nominations by employment sector are shown in Table 2. The total number of nominations was the lowest this year since 2004 and was noticeably lower than last year in all employment sectors. The number of nominations from government was considerably lower this year than in the other eight years included in this report, and the number of nominations from business/industry was the second-lowest in the nine years included in this report.

So, how have the nominations fared in each of the employment sectors? As shown in Table 3 and Figure 3, nominations submitted this year from the business/industry and government sectors fared better than those in the previous two years, and those from academe were similar to those submitted in the previous three years.


Gender
The membership of the ASA has changed significantly in the percentages of females and males, as illustrated in Table 4 and Figure 4. This table looks at the current ASA membership and subsets that joined the ASA in ranges of previous years.
Assuming the number of departures from ASA membership has been proportional to gender (i.e., females and males are equally likely to discontinue or retain ASA membership), there has been a noticeable increase in the percentage of female members.


The ASA Fellow award is almost always given to ASA members who have reached mid-career, and as such, the gender percentages of ASA membership that are appropriate reference points for years 2004–2012 are those reflecting members who joined the ASA on or before 1994–2000. Thus, the relevant reference percentages for females for Fellow nominations and awards are in the 20% to 23% range.
The counts and percentages by gender of ASA Fellow nominations in 2004–2012 are presented in Table 5.

Table 5—Counts and Percentages of ASA Fellow Nominations by Gender
The percentage of female nominees in 2012 was consistent with the reference percentages.
The counts and percentages by gender of ASA Fellow awards in 2004–2012 are presented in Table 6, and the percentages are presented in Figure 5.


The percentages of female Fellow awardees have been generally reflective of the reference percentages. As shown in Table 7 and Figure 6, the decline in the percentage of female Fellow awardees in 2009 was due simply to the lower percentage of female Fellow nominations. For nominees, the average chance of success is somewhat higher for females.


Conclusion
The number of Fellow nominations from a given employment sector or gender is a key factor in determining the number of awards from that sector. The other obvious key factor is the quality of the nominations. To increase the number of Fellow awards in an employment sector or gender to achieve parity in the percentages of awards relative to the percentages of ASA membership (see figures 2 and 5), the number of nominations from that sector or gender needs to increase, and these nominations need to be of good quality.
The ASA Fellow award is a significant recognition of contributions to the statistics profession, and one that should reflect the constituency of the ASA membership. If you or others you know are deserving of this award, please participate in and encourage others to participate in the award nomination process.
As a life member and ASA fellow i have long advocated better representation from the industry sector for many years. I think improvements were made around the time when Gerry hahn chaired the committtee. I would like to serve on the committee myself.
One thing that should be kept in mind when looking at parity is that we are making a tacit assumption that qualified fellows are equally distrbuted by employment sector and gender. This may or may not be the case. We do seem to have a large number of women in the leadership ranks and among the fellows of ASA. It is probably fair to say that women deserve to be represented according to their membership size as ASA fellows. The percentage of fellows in industry perhaps should not be as large as those in academia because there may be more statisticians who have made worthy contributions in the academic employment sector. But the decline shown over the last three years is disturbing and may reflect unfair underrepresentation for industry,
I think a problem that exists is that fellowship may be more highly regarded and sought in academia and many academics with nominate candidates and almost always nominate fellow academics. There is also the possibility that the quality of the nominations is better amongst the academics.
I think the possibility that industrial statisticians may be underrepresented should be kept in mind by all of us and we should consider nominating more of the well-qualified industrial statisticians that we know. A few years ago after a couple of attempts my nomination of Mark Chang was successful.