• Skip to main content
  • Skip to secondary menu
  • Skip to primary sidebar
  • Skip to footer
  • Homepage
  • About Us
  • Advertising
  • Submission Instructions
  • Editorial Calendar
Amstat News

Amstat News

The Membership Magazine of the American Statistical Association

  • Printed Issues
  • Practical Significance Podcast
  • Additional Features
  • Columns
  • Member News
  • Departments
You are here: Home / Cover Story / 2018–2019 Academic Salary Survey

2018–2019 Academic Salary Survey

June 1, 2019 Leave a Comment

Brittany Ange and Varghese George of the Medical College of Georgia at Augusta University and
Donna LaLonde and Ron Wasserstein of the ASA

    The 2018–2019 academic salary survey includes both faculty and nonfaculty statisticians and biostatisticians. We received responses from 66 institutions in the United States. The data include 996 faculty and 208 nonfaculty statisticians, with gender information. The quartiles and 90th percentile for relevant categories are provided in the summary tables.

    Faculty Data

    The faculty data set, comprised of 640 males and 356 females, include faculty members in 20 statistics departments (N=360), 28 biostatistics departments (N=496), and 18 math sciences departments (N=140). Departments classified as both math and statistics were included with the mathematical sciences departments.

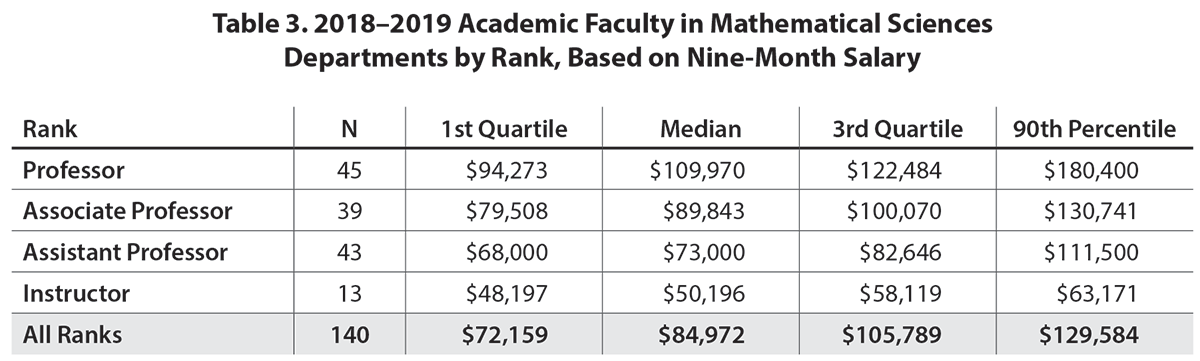
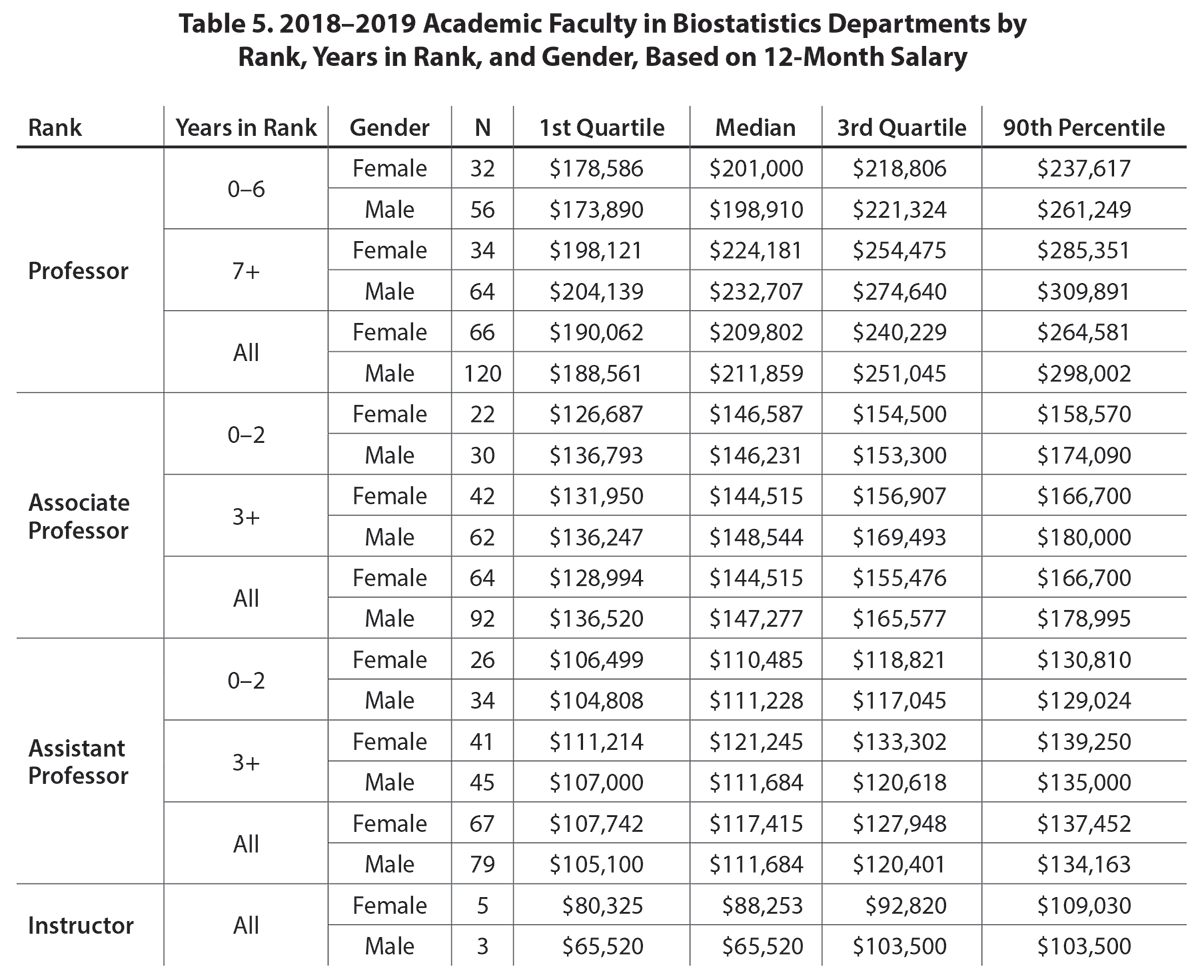
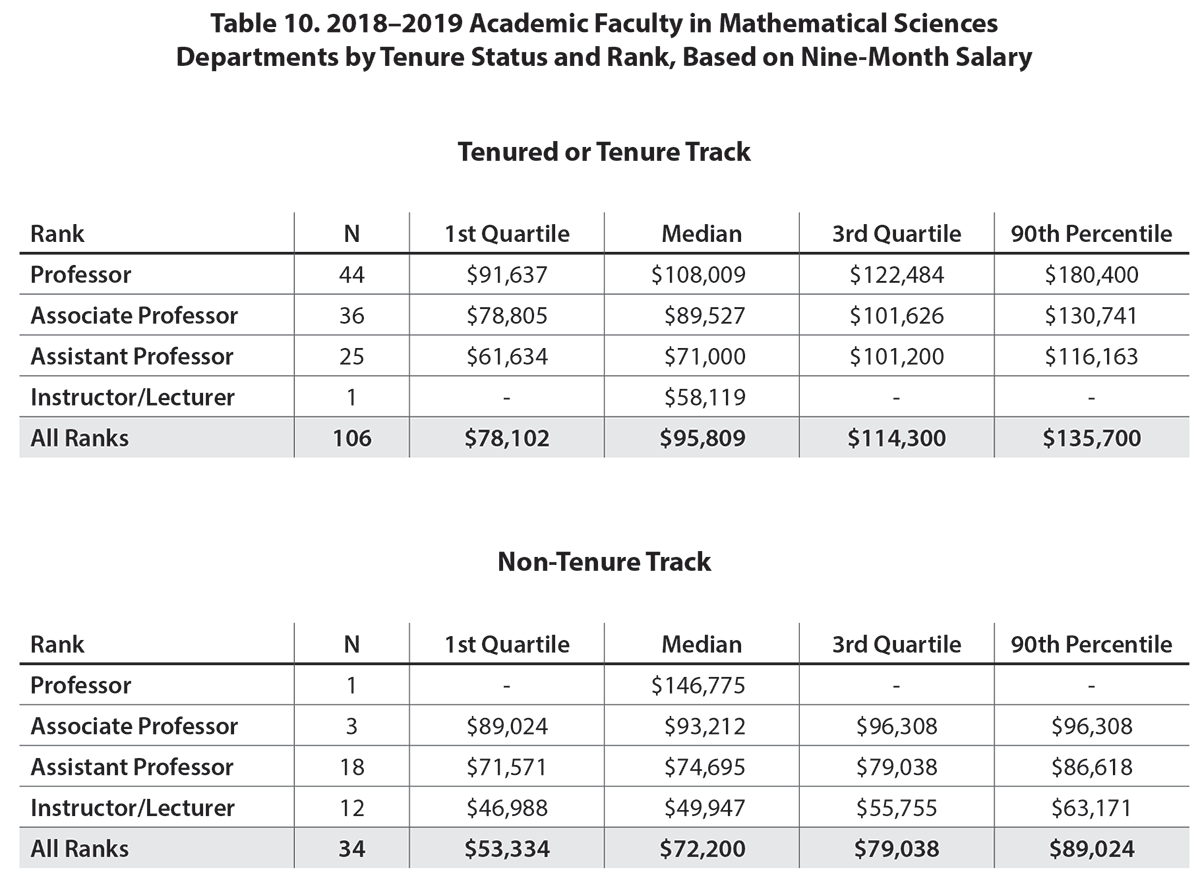
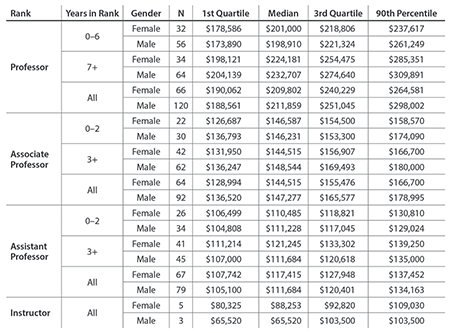
    Table 1 summarizes salary information for full-time academic faculty in statistics departments by rank and years in rank, based on nine-month salary. Table 2 provides similar information for full-time academic faculty in biostatistics departments, but is based on 12-month salary. Table 3 summarizes salary information on full-time academic faculty in the mathematical sciences departments by rank, based on nine-month salary. The salaries of all statistics and mathematical sciences faculty with contracts other than nine-months were adjusted appropriately to a nine-month salary. Similarly, the salaries of all biostatistics faculty with contracts other than 12-months were adjusted appropriately to a 12-month salary. Tables 4, 5, and 6 provide similar percentiles for the groups in Tables 1, 2, and 3, respectively, stratified by gender. Tables 8, 9, and 10 provide salary information by tenure status.

    Nonfaculty Data

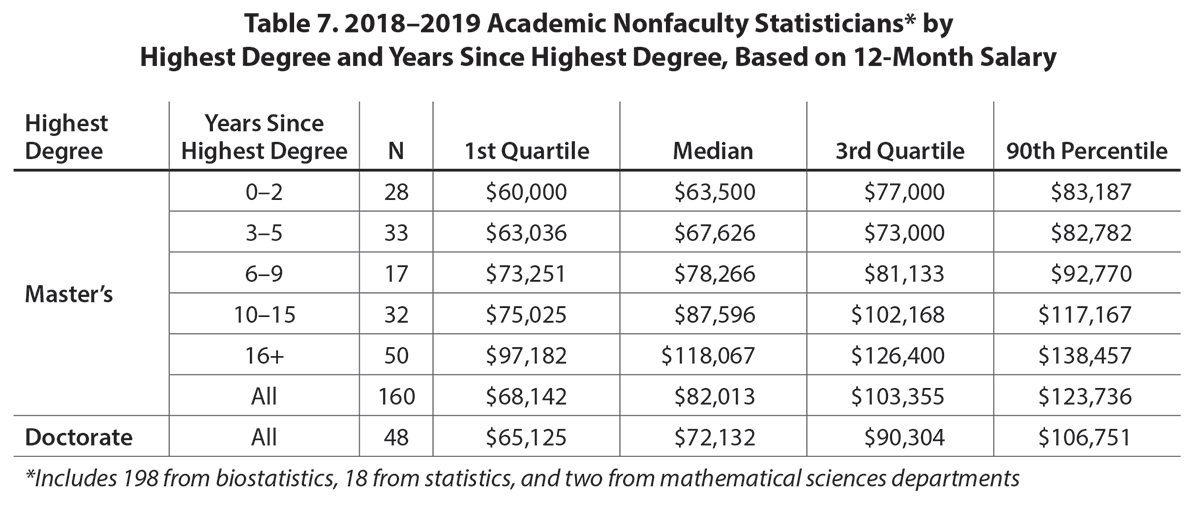
    The nonfaculty data set includes 208 observations from 22 institutions, with 48 observations at the doctoral level and 160 at the master’s level. Of the 208 individuals, there are 198 from biostatistics departments, 18 from statistics departments, and two from mathematical sciences departments. Departments classified as both math and statistics were included with the mathematical sciences departments.

    Table 7 provides their salary distribution, stratified by highest degree (master’s or doctorate), and years since obtaining the highest degree.
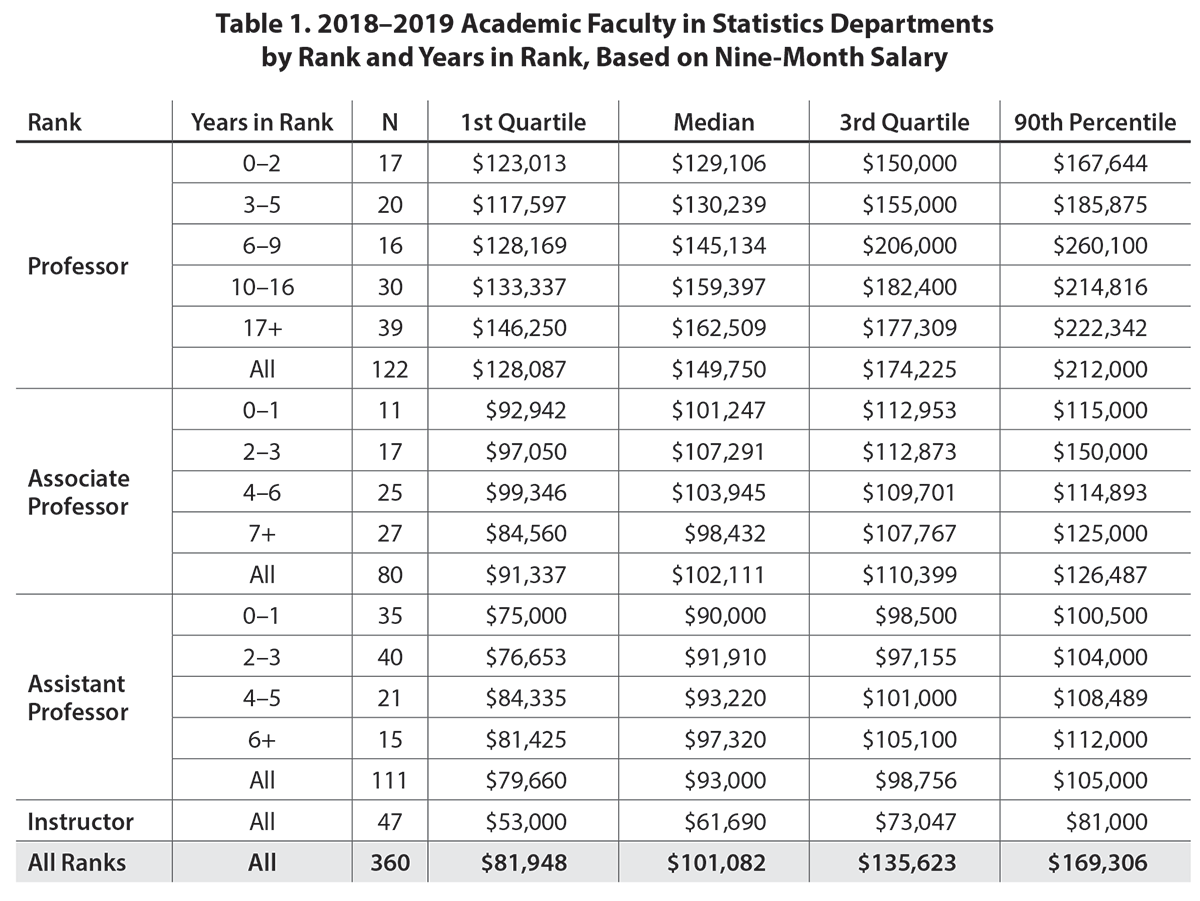
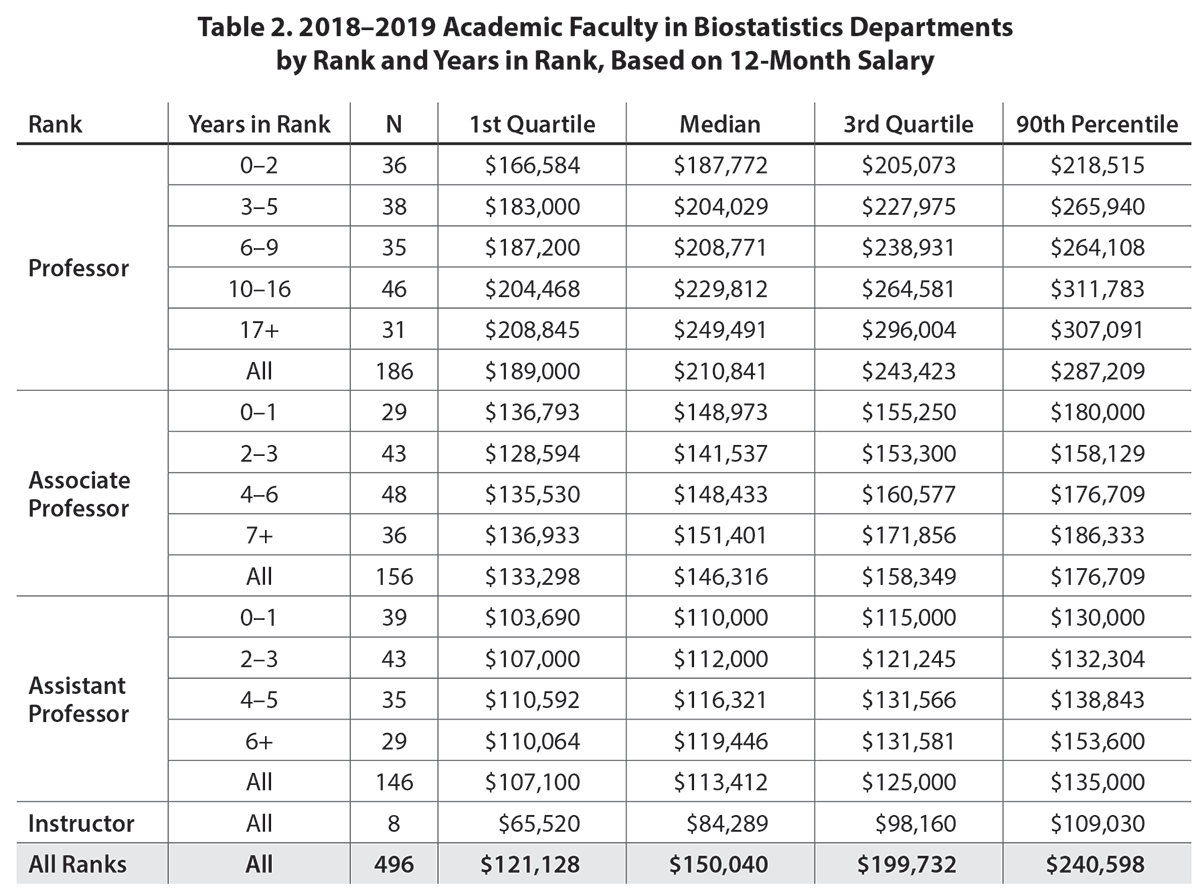
    Table 1. 2018–2019 Academic Faculty in Statistics Departments by Rank and Years in Rank, Based on Nine-Month Salary


    Table 2. 2018–2019 Academic Faculty in Biostatistics Departments by Rank and Years in Rank, Based on 12-Month Salary


    Table 3. 2018–2019 Academic Faculty in Mathematical Sciences Departments by Rank, Based on Nine-Month Salary


    Table 4. 2018–2019 Academic Faculty in Statistics Departments by Rank, Years in Rank, and Gender, Based on Nine-Month Salary


    Table 5. 2018–2019 Academic Faculty in Biostatistics Departments by Rank, Years in Rank, and Gender, Based on 12-Month Salary


    Table 6. 2018–2019 Academic Faculty in Mathematical Sciences Departments by Rank and Gender, Based on Nine-Month Salary


    Table 7. 2018–2019 Academic Nonfaculty Statisticians* by Highest Degree and Years Since Highest Degree, Based on 12-Month Salary


    Table 8. 2018–2019 Academic Faculty in Statistics Departments by Tenure Status, Rank, and Years in Rank, Based on Nine-Month Salary


    Table 9. 2018–2019 Academic Faculty in Biostatistics Departments by Tenure Status, Rank, and Years in Rank, Based on 12-Month Salary


    Table 10. 2018–2019 Academic Faculty in Mathematical Sciences Departments by Tenure Status and Rank, Based on Nine-Month Salary

    Filed Under: Cover Story Tagged With: 12-month, academic salary survey, biostatistics, degree, faculty, nine-month, non-faculty, non-tenure, rank, statistics, tenure

    Reader Interactions

    Leave a Reply Cancel reply

    Your email address will not be published. Required fields are marked *

    Primary Sidebar

    Search

    More to See

    Jennifer L. Green: The Collaborative Life of a Statistics Professor and Teacher Mentor

    September 1, 2026 By Megan Murphy

    Meetings, Manuscripts, and Meows: Spend a Day with Charlotte Walsh

    September 1, 2026 By Megan Murphy

    Students’ Statistical Thinking When Using Generative AI

    September 1, 2026 By Megan Murphy

    What Students Taught Me About Teaching Statistics

    September 1, 2026 By Megan Murphy

    STATAcorp. Efficiency matters. Stata is easy to use, so you spend less time learning software and more time focusing on your research
    Data Science Certification

    ASA HOME

    American Statistical Association

    Communications from the Executive Director

    ASA Leader Hub

    ASA Career Connect

    ADVERTISERS

    STATA
    SIAM

    Archives

    Categories

    Footer

    Editorial Staff

    Managing Editor
    Megan Murphy

    Graphic Designers / Production Coordinators
    Olivia Brown
    Meg Ruyle

    Communications Strategist
    Val Nirala

    Advertising Manager
    Christina Bonner

    Contributing Staff Members
    Kim Gilliam

    American Statistical Association
    277 South Washington Street, Suite 370
    Alexandria, VA 22314-3646
    Phone: (703) 302-1857


    Copyright © 2026 · Magazine Pro on Genesis Framework · WordPress · Log in