
This series features ASA members who share their ASA stories. Our mission is to collect authentic and meaningful accounts of member experiences. If you have a story you would like to share, email the ASA’s marketing and communications coordinator, Kim Gilliam.
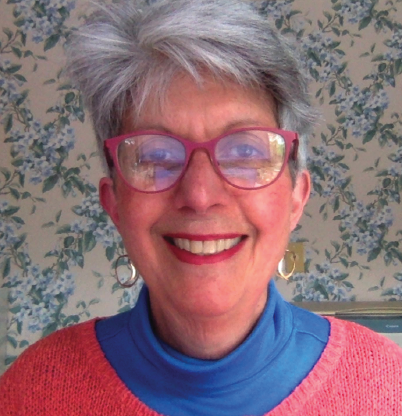
In 2011, I was honored to be selected for the Albert Einstein Distinguished Educator Fellowship Program, which allows educators to bring their insights from the classroom to Washington by working in branches of the federal government, including on the Hill.
I was an education legislative aide to Senator Al Franken. When Senate staffers learned I taught math and statistics, they were eager for help on the statistical data they were working with. I said, “I already have a day job, but let me see what I can do.”
Ultimately, ASA Director of Science Policy Steve Pierson and I developed “Stat for Staffers,” a monthly education program for Senate administrative staff. This was held in conjunction with the Senate Office of Education and Training in a series titled, “Critical Statistical Thinking.” ASA member speakers included John Bailer, Miami University; Norean Sharpe, Georgetown University; Bonnie LaFleur, Ventana Medical Systems; Michael Larsen and Mary Foulkes, The George Washington University; Michael Costello, RTI International; Frank Yoon, Mathematica Policy Research; and Jessica Utts, University of California, Irvine.
Stat for Staffers was attended monthly by 40 to 60 people; it was truly rewarding to have made an impact such as this on behalf of the statistics profession.
Extra Tools in Your Toolbox
Being a member of the ASA makes me feel like more than “just a high-school math teacher.” I joined the association when I started teaching Advanced Placement Statistics in Boston. I needed all the resources I could find since I was a “sole practitioner,” being the only statistics teacher in my school.
Being a member of the ASA makes me feel like more than ‘just a high-school math teacher.’
Today, I am the curator, writer, and moderator for “What’s Going On in This Graph?” This is a free, weekly feature of the New York Times Learning Network in partnership with the ASA. It is the only math-oriented feature of the network and has one of the largest followings.
There are so many opportunities available to ASA members. My advice to fellow members is to get active at both the national and local levels of the ASA. I’ve made many professional friendships that have resulted in helpful statistical assistance and new opportunities.
My advice for students interested in the field? Learn as much about statistics as you can, not just one field of application. Whatever field you go into, it’s beneficial to have those extra statistical tools in your toolbox. And, especially since statistics is a relatively young field, never stop seeking what is new.
Thank you for your work with the NYT “What’s Going on In This Graph.” I am excited to use it with my students. We participated for the first time this week and it was great; it fit right in to our current 8th grade Earth Science unit on minerals and local mining debates.
I am curious, what are some good statistics or data analysis resources, projects, learning materials the ASA would recommend for elementary grades (I’m thinking K-4)? Thank you for your work to help grow data-curious and data-literate citizens!