
Jessica Karch, Jennifer Noll, James K. L. Hammerman, and Traci Higgins
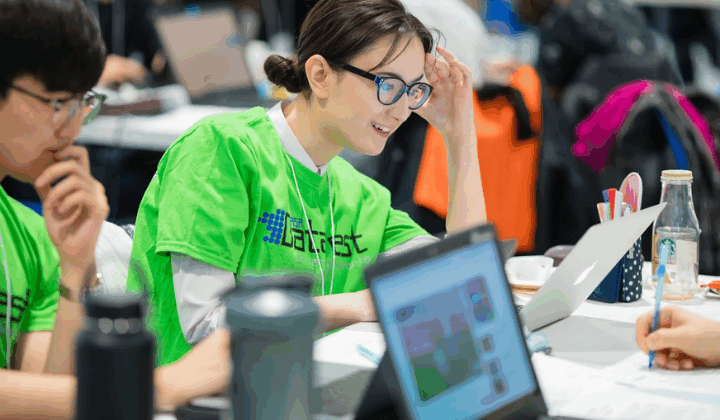
During the first year of our National Science Foundation-funded project, we set out to understand what drives students to take part in DataFest, as well as what discourages participation. To do so, we collected multiple streams of data from six DataFest sites: surveys with Likert items and free-response questions implemented with both DataFest participants and nonparticipants before the event; semi-structured interviews with DataFest participants; and surveys about participants’ experiences at DataFest implemented after the event. When we ran a logistic regression comparing survey responses from DataFest participants versus nonparticipants, we found one variable that significantly predicted DataFest participation was the extent to which students perceived DataFest as “for me.” When we shared this with the organizers, they asked us what “for me” means.
Unpacking what contributes to a sense of belonging is not a trivial task. At an event like DataFest, many personal and professional factors may contribute. Students’ majors, personal identities, and how relevant they perceive the DataFest challenge is to their personal and professional goals may all influence whether they see DataFest as an event for someone like them. Belonging at a data science event may also intersect with feelings of belonging in data science as a field more generally.
According to Zippia, approximately 80% of all data scientists in 2021 were men and 64% were white. Prior research suggests that to make data science more inclusive, it’s important to challenge some of the exclusionary culture baked into data science and STEM fields more generally. Creating opportunities that are more collaborative than competitive; that affirm students’ identities and protect students from racialized and gender-based stereotypes and experiences of microaggressions; and that are intentionally designed for inclusion, social justice, and social impact are all important to welcome students who have been historically marginalized in data and computer science.
Our data could not conclusively answer what mediates a sense of belonging at DataFest. This came down largely to the limitations of our data. Our data set offered rich insight into the experiences of participants at DataFest, with many paired pre/post responses and rich semi-structured interviews. Our data on nonparticipants, however, reflected many of the same limitations organizers faced when trying to recruit students to take part in DataFest. We recruited participants through organizers’ existing campus networks, so it is difficult to say who our data set included and who was left out. Although we had similar response rates between participants and nonparticipants overall, nonparticipant response rates varied widely from site-to-site, especially in the first year of our study. Importantly, our data reflected the same gender and racial underrepresentation many organizers saw among their majors and events. To gain insight into the question of “for me,” we had to turn away from our quantitative survey data to qualitative survey free responses and interviews with DataFest participants.
A common refrain about DataFest is that it is an event for a bunch of data nerds geeking out. This idea was reflected by both organizers and students. In fact, one DataFest participant in our data set lamented DataFest wasn’t geeky enough.
The nature of the ‘secret’ data set may contribute to this data nerd perception. While other kinds of hackathons and datathons lure students in by inviting them to engage with data problems relevant to their lives or majors, an important feature of DataFest is that the data set remains secret until the Friday evening kickoff. This means a primary draw of DataFest is excitement to work with authentic data, no matter what the data is.
Data nerds were not necessarily data science and statistics majors. A data nerd could be someone who minored in data science, who had an interest in data without formally studying it, or who was interested in learning how data works in ways that could help them in other domains, such as business or the social sciences.
This perception of DataFest being for data nerds meant some students believed advanced data and coding skills were needed to participate in DataFest. However, we also found that the perception of DataFest as being only for experienced data science students could be challenged by the influence of peers and faculty mentors. One participant, for instance, was encouraged to join by a supportive teacher who emphasized there were no expectations and they would do just fine. Several others shared that personal encouragement helped make the idea of taking part in DataFest feel less intimidating.
Other participating students who did not think they had strong data science or computing skills struggled to reframe their own contributions at first, but participating in DataFest helped them shift their perspective on what kind of skills are valuable for data science.
In interviews, we found soft skills were just as important to team success at DataFest as computing or data skills. Being able to design a beautiful presentation, communicate their findings and analysis clearly, and having knowledge or lived experiences that were relevant to the domain of inquiry were all crucial skills to complete the DataFest challenge.
Our advice to organizers: Data nerdom is expansive and multifaceted. Our findings suggest students find many pathways to engage in and become excited about data. Furthermore, a sense of belonging does not happen by accident. As Alex Fisher and Maria Tackett discuss in “A Point of View: Duke University,” it takes intentional work to create a more inclusive and successful event. We encourage organizers to carefully consider why they are hosting DataFest and how that goal shapes their messaging about DataFest and who they envision as the ideal DataFest participant.
Some questions for organizers to consider are the following:
- Who counts as a ‘data nerd’? Does being a data nerd imply a specific skill set or affinity for specific statistical and computational disciplines? Do social science or other students who work with data count? How does this affect your recruitment?
- Who is your DataFest event currently engaging and how? Who among your students and faculty can act as local DataFest champions, and how can you activate those folks to intentionally and individually invite and encourage students who may not otherwise see themselves as part of DataFest?
- Which students are being systematically excluded from broader data science and statistics programs, and how can you help shift the culture of their programs? If your program has successful inclusion efforts, what has made it successful and how can you help those continue to build and grow?
- Are there opportunities to partner with local community colleges to broaden the impact of their DataFest event?
From our experiences, it is incredibly challenging to understand patterns of participation at an event like DataFest, which recruits broadly and may differ from site to site. Next steps for research can be to work with organizers and students on a case study basis to do a deeper exploration of factors that influence participation at single events.
Some questions for researchers to consider are the following:
- How does culture at a given event, institution, or field impact how marginalized students do or do not see an event as “for me”? How are narratives constructed around what kinds of skills are or are not valuable in a data space?
- How is your data situated within a broader ecosystem? How do you make sense of your phenomenon within that ecosystem?
- Who did you sample from, and how do you know that sample is representative? Whose voices are included, and whose are excluded? How do those patterns of inclusion and exclusion help you gain insight into your phenomena of interest?
- What mediates belonging at DataFest and similar kinds of datathon events?
- What practices and/or structures can lead to a stronger workforce and better outcomes for young people looking to build meaningful and productive careers in data science?
Editor’s Note: This material is based on work supported by the National Science Foundation under Grant No. DUE 2216023. Any opinions, findings, and conclusions or recommendations expressed in this material are those of the authors and do not necessarily reflect the views of the NSF.
Jessica Karch
Karch is a senior researcher at TERC, which uses qualitative and mixed methods to study science learning and learning environments at the undergraduate and graduate levels with a focus on equity.
Jennifer Noll
Noll is principal investigator at TERC. Her background focuses on K-12 and undergraduate statistics and data science education through innovative curricula, technology, and teacher professional development.

James K. L. Hammerman
Hammerman co-directs the STEM Education Evaluation Center at TERC. For more than 20 years, he has worked as an evaluator, designer, teacher educator, and adviser for innovative statistics and data science education projects, engaging formal and informal learners of all ages to investigate and make sense of data.
Traci Higgins
Higgins is a senior researcher in STEM education at TERC. She has more than 20 years’ experience conducting research and developing educational materials, processes, and models to support STEM learning and teaching both in and out of school, focusing on K-8 mathematics, data science K-12+, the social sciences, and interdisciplinary thinking.
I appreciate how this piece captures the spirit of DataFest as more than just a competition, but a proving ground where curiosity, collaboration, and real world problem solving come together. It highlights the value of working with messy, imperfect data, reinforcing the idea that true skill is developed not in ideal conditions, but in complexity and uncertainty .