Reviewing Results from the 2009 JSM Presenter Satisfaction Survey
Dave Judkins, 2011 JSM Program Chair

Dave Judkins, 2011 JSM Program Chair
Following the 2009 Joint Statistical Meetings last summer, a new set of surveys was sent out to presenters. They were all on the subject of satisfaction with the presentation experience but had tailored questions for the various session types and presenter roles. Note that this survey was in addition to the standard satisfaction survey that is sent out to registered attendees of the JSM. That survey focuses on the satisfaction of the audience. The new survey focuses on the satisfaction of the person on the other side of the podium.
One thing ASA staff have impressed on the Committee on Meetings is the pressure placed on the entire convention planning process by the very high ratio of lecture-style presentations to total attendance. Other societies have an easier time with convention facilities because they have a lower value of this ratio—either because more of the presentations are poster presentations, which require far less floor space per presenter, or because more of the attendees do not make any presentation. If we were able to somehow reduce our value of this ratio, we would have several benefits:
- More options for convention centers with adequate capacity
- Lower cost at the JSM since less overall floor space would be required
- Choice of a personalized program to attend, which would not be as intimidating a task for participants
- Reduced walking distance between halls
Given these considerations, the new survey was launched for two reasons: to better understand the reasons why presenters prefer to give lecture-style presentations and to explore what their reactions might be to changes in convention organization rules.
The new survey also includes speaker estimates of audience size. These were collected in the hope that they would help mitigate the perennial problem of mismatched room capacity and audience draw. Every year, complaints about mismatches are the most commonly heard complaint, but it turns out to be very difficult to project audience draw. Past attempts to use chair reports of audience draw to improve the allocation of rooms to sessions have been only marginally successful. It was hoped that a new source of measurements might lead to improved allocations.
The response rate was 43%. Although I would consider this low for a survey on some question of economic suffering, it seems perfectly adequate to me as a tool for improving the satisfaction of JSM presenters. The squeaky wheel does get the grease.
Let me also add a belated note of sympathy to the Census Bureau report writers whom I used to torture as part of the mandatory statistical review of bureau reports in my younger days. I now feel their pain more distinctly. It is not easy to satisfy a panel of statisticians. The broad outline of the results seems fairly obvious when one inspects the tables even without any quantification of uncertainty. Inevitably, however, in the course of preparing a large number of even moderately complex tables and discussing what seem to be interesting points from them, one is confronted by the fact that satisfying the strictures of best statistical practice is not easy. Sparse tables invalidate asymptotic chi-square tests of independence. The use of exact tests is bedeviled by the question of whether to condition on the margins. Pair-wise t-tests invite a profusion of false positive findings. Bayesian procedures are attractive but my priors are different from someone else’s, and this turns out to matter. Maybe, though, since the primary audience for this article is other statisticians, we can present the raw numbers for the most part and trust that you, the reader, will apply your favorite hypothesis test or shrinkage procedure with posterior Bayes estimates.
Satisfaction Across Presentation Formats and Presenter Roles
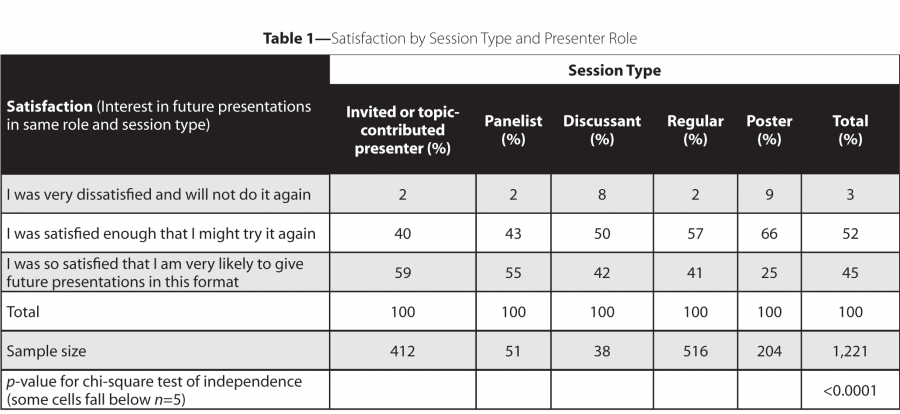
Table 1 shows how presenter satisfaction varies across session types and speaker roles. Few presenters were so dissatisfied with the experience that they would never repeat it, but this feeling is most common among discussants and poster presenters: 8% of discussants and 9% of poster presenters were very dissatisfied with the experience.


 (No Ratings Yet)


