
Keith Crank, ASA Research and Graduate Education Manager
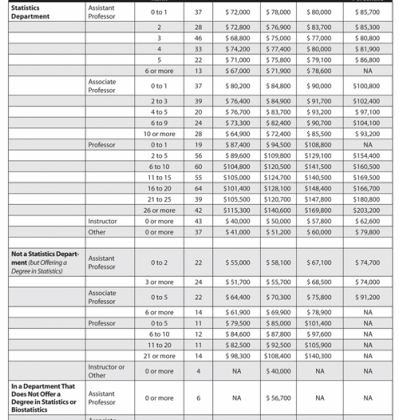
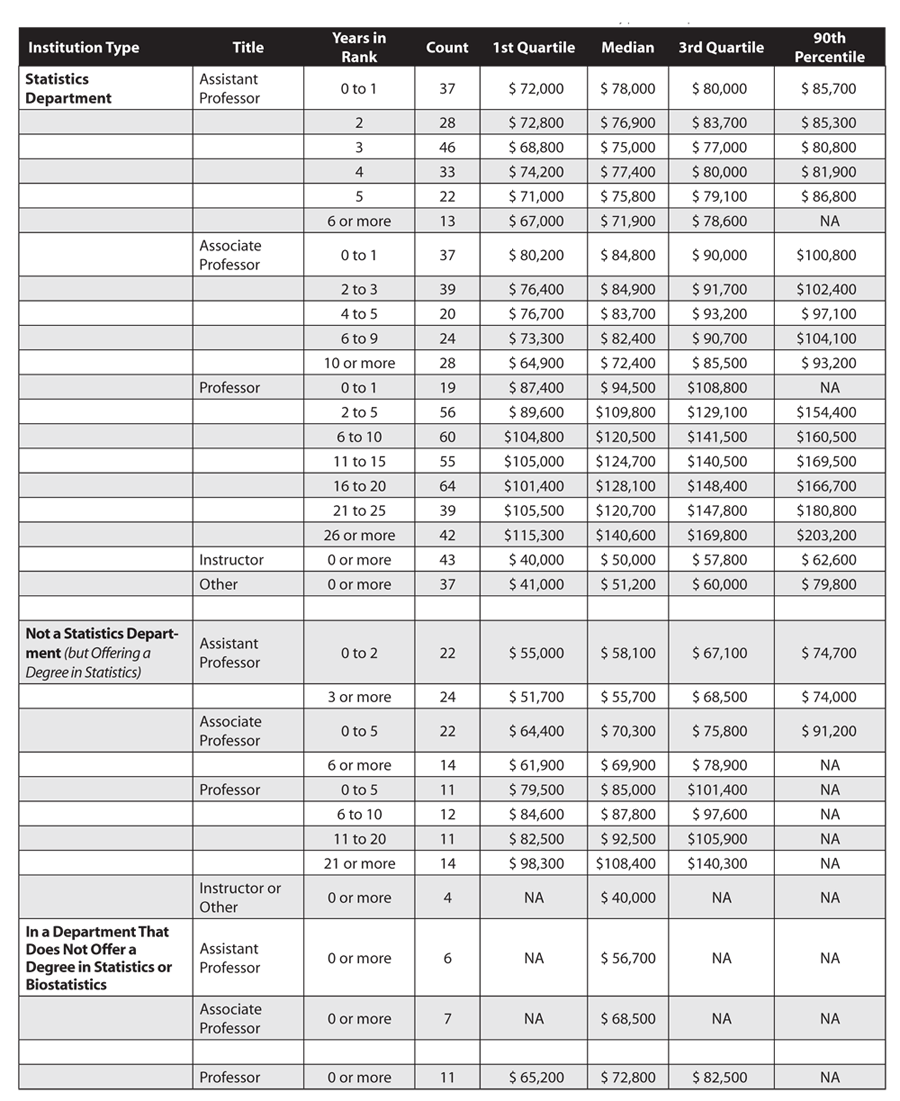
Table 1 provides salary information for statistics faculty, separated according to the type of institution. Table 2 provides salary information for statistics faculty based on type of department. (Biostatistics faculty are not included in either of these tables.) All quantiles in tables 1 and 2 are based on nine-month salaries and rounded to the nearest $100. Information about biostatistics faculty and nonfaculty statisticians and biostatisticians in academic institutions will be provided in a future issue of Amstat News.
Table 1—2009-2010 Salaries of Academic Statisticians Based on Type of Institution

Table 2—2009-2010 Salaries of Academic Statisticians Based on Type of Department
Beginning this year, gender information was requested. While tables such as 1 and 2 are possible, including the small counts of female faculty members within each category would make them of limited value. (For most categories, only the median would be reported.) As an alternative, Figure 1 shows the impact of women’s salaries on the overall results. For assistant professors, associate professors, and full professors (in the obvious order) in statistics departments, the graph shows fitted (lowess) curves of salaries by years in rank. This is done for all data for which gender was provided, as well as for men’s salaries only. (While curves could be fit for women, the limited amount of data makes these curves less reliable.) To help in interpreting the curves, the combined curve for full professors is based on 319 data points, while the related curve for men is based on 290 data points. Similarly, for associate professors, the two curves are based on 140 and 94 data points, and for assistant professors, they are based on 166 and 109 data points.
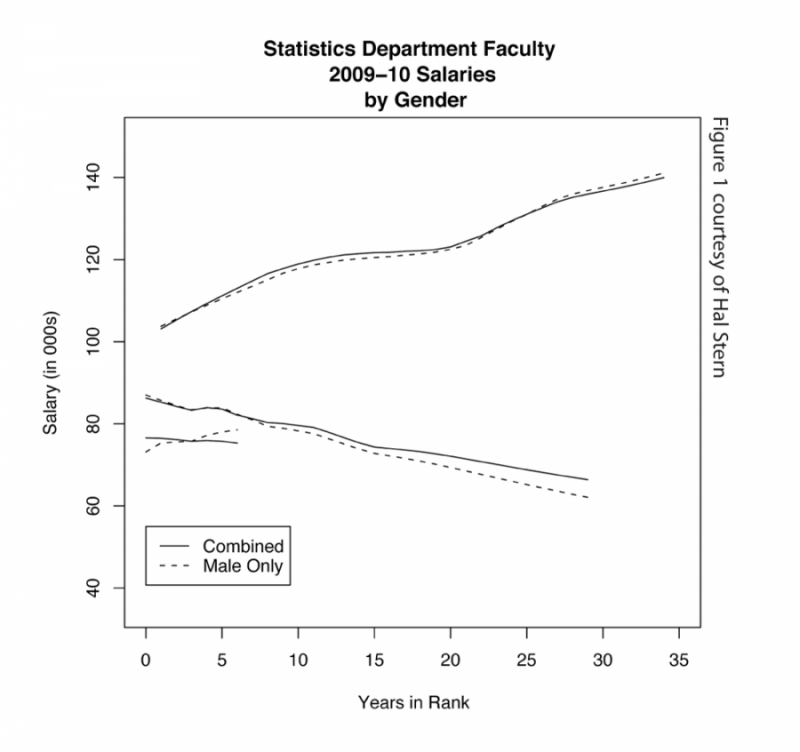
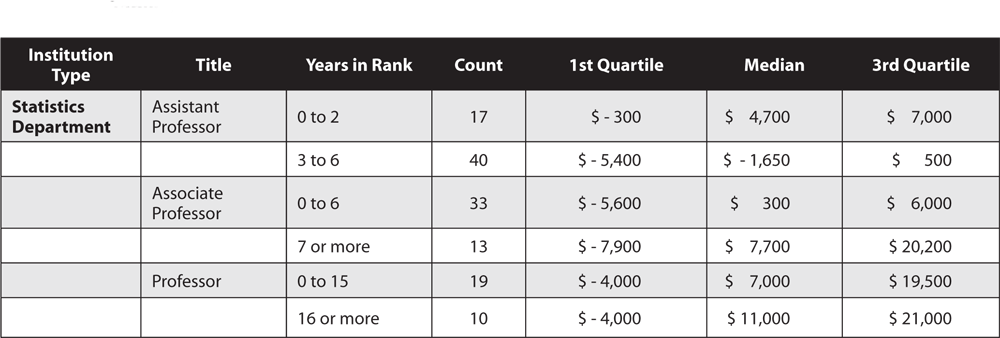
Table 3 shows the quartiles of the deviations of female faculty salaries from the fitted curves for male faculty salaries. The breaks in years in rank were chosen so the cell sizes were not too small, but would still allow the differences to be identified.
Table 3—Quartiles for Deviations of Female Faculty Salaries from Fitted Curves for Male Faculty Salaries
Leave a Reply