• Skip to main content
  • Skip to secondary menu
  • Skip to primary sidebar
  • Skip to footer
  • Homepage
  • About Us
  • Advertising
  • Submission Instructions
  • Editorial Calendar
Amstat News

Amstat News

The Membership Magazine of the American Statistical Association

  • Printed Issues
  • Practical Significance Podcast
  • Additional Features
  • Columns
  • Member News
  • Departments
You are here: Home / Featured Stories / Biostatistics Salary Survey

Biostatistics Salary Survey

January 1, 2012 2 Comments

Keith Crank, ASA Manager of Research and Graduate Education

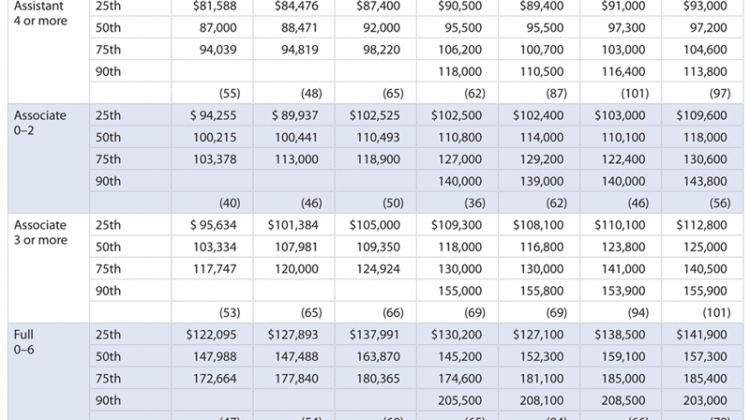
    Table 1 includes results from the fall 2011 Salary Survey of Biostatistics and Other Biomedical Statistics Departments and Units, conducted by the ASA. All salary figures are for a 12-month period. As in the past, previous salary survey data have been included for comparative purposes. (This year, we have included the 90th percentiles and the quartiles.) The estimates are based on responses from 35 departments, plus a few individuals who responded to the survey.

    Beginning with the 2009 survey, gender data were collected along with the salary information. Table 2 provides the 2011 percentiles for the groups in Table 1 separated by gender.

    In 2011, we continued to collect data on nonfaculty, academic statisticians, and biostatisticians. Table 3 provides information about the salaries for full-time, nonfaculty, academic biostatisticians. (There were not enough responses for nonfaculty, academic statisticians to provide summary statistics.) Quartiles are provided for categories with nine or more respondents. The 90th percentile is provided for any category with 19 or more respondents. All percentiles are rounded to the nearest $100. (The information for two people with master’s degrees did not include years since highest degree. They are included in the row marked “All.”)

    Filed Under: Featured Stories Tagged With: academic biostatisticians, biomedical statistics, biostatistics, salary survey

    Reader Interactions

    Comments

    1. Jim Frane says

      January 10, 2012 at 11:01 pm

      Has anyone done any analysis over time adjusted for CPI-U-RS?

      Reply
    2. bj says

      March 15, 2012 at 5:43 pm

      How does one obtain data for chairs/division chiefs/etc. from these data? Is there a way to obtain a credible estimate of the salary distribution for these folks? It would be helpful.

      Reply

    Leave a Reply Cancel reply

    Your email address will not be published. Required fields are marked *

    Primary Sidebar

    Search

    More to See

    2024–2025 Degree Data: Awarding of Statistics, Biostatistics Degrees Steady Amid Staggering Growth for Data Science, Analytics Degrees 

    October 1, 2026 By Olivia Brown

    Member Showcase: Robert Oster on the Power of Collaboration, Leadership, and Giving Back

    October 1, 2026 By Olivia Brown

    Who’s Missing from the Data? The Case for Disability Inclusion 

    October 1, 2026 By Olivia Brown

    Meet New Member Naren Prakash: Aspiring Statistician with a Love for Statistical Research 

    October 1, 2026 By Olivia Brown

    Data Science Certification

    ASA HOME

    American Statistical Association

    Communications from the Executive Director

    ASA Leader Hub

    ASA Career Connect

    STAFF LIST

    Kim Gilliam
    Naomi Friedman
    Amanda Malloy

    Archives

    Categories

    Footer

    Editorial Staff

    Managing Editor
    Megan Murphy

    Graphic Designers / Production Coordinators
    Olivia Brown
    Meg Ruyle

    Communications Strategist
    Val Nirala

    Advertising Manager
    Christina Bonner

    Contributing Staff Members
    Kim Gilliam

    American Statistical Association
    277 South Washington Street, Suite 370
    Alexandria, VA 22314-3646
    Phone: (703) 302-1857


    Copyright © 2026 · Magazine Pro on Genesis Framework · WordPress · Log in