

With a PhD in statistical astrophysics, David Corliss leads a data science team at Fiat Chrysler. He serves on the steering committee for the Conference on Statistical Practice and is the founder of Peace-Work, a volunteer cooperative of statisticians and data scientists providing analytic support for charitable groups and applying statistical methods in issue-driven advocacy.
As we wind up our 2020 series on technology and Data for Good, we’re looking at poverty and how statistical science is making an impact through data, improved understanding, and analysis.
Awareness of poverty in the United States as a matter to be addressed in some way at a national level goes back to America’s earliest days. The preamble of the US Constitution mentions the need to “promote the general Welfare” among the reasons for its creation. In the 20th century, coordinated action to collect data and analyze and understand it to act on poverty began with the War on Poverty program in 1964. A national standard for poverty was developed: The Poverty Line, sometimes known as the Orshansky Poverty Threshold. The concept implemented at this time was a hunger threshold, with food insecurity as the benchmark for poverty. A set of dollar figures was set for households of different sizes and numbers of children at three times the level needed for spending on food.
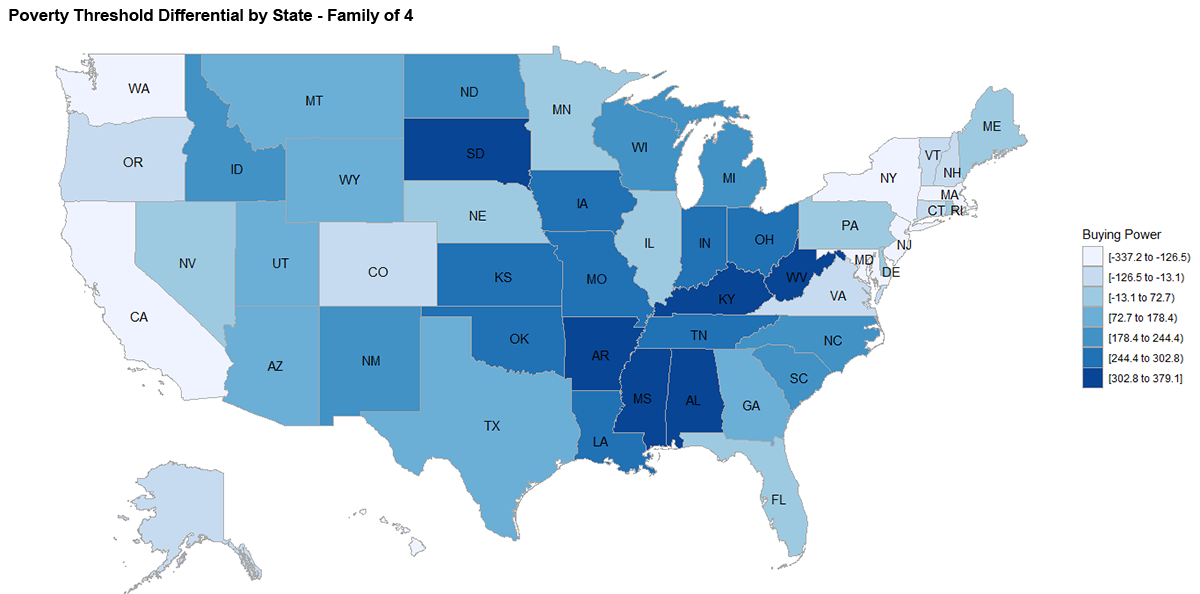
While this is a helpful concept, methodological issues immediately arose. The threshold doesn’t take into account variations in the cost of living from one place to another, a classic example of what some have called the “flaw of averages.” This results in considerable regional variations in the buying power of the poverty threshold.
As one example, Peace-Work used the relative purchasing power from the Bureau of Economic Analysis, found the percent difference between states, and multiplied by the poverty threshold for a family of four to translate it to a dollar amount. For those on a fixed income, that income goes a lot further in some places. However, the working poor in lower-income states face a gap due to the difference between local wages and price of commodities that don’t vary much by location. This gap can be substantial—as much as $379 a month for a family of four in one state (Arkansas).
Each year, the poverty threshold is adjusted for inflation using the Consumer Price Index. However, this is the only adjustment made, resulting in longitudinal drift from the original concept and metrics used to develop it. While many changes in buying habits, household spending, availability of and use of different goods, and especially portion of a household budget and the prices of different components in the original calculation have occurred over the years, the US poverty line and a multitude of programs pegged to it continue to be based on a household food expenditure survey taken in 1955.
A number of methods have been suggested to address these concerns. The US Census Bureau has developed a Supplemental Poverty Measure (SPM) to address a number of them. The Institute for Research on Poverty (IRP) at the University of Wisconsin-Madison gives an excellent description of the SPM, with a point-by-point comparison to the official Poverty Threshold. The IRP has a number of other helpful resources available on its website. Data for Good researchers interested in poverty research will definitely want to check it out.
The IRP has contracted with HHS to create the National Poverty Research Center, which informs and supports policy, conducts training, and performs research on poverty in the United States. The work of the IRP and the resources they have made available foster better understanding of the many dimensions of poverty. This empowers the development of the materials, technology, and analysis needed to identify and implement data-driven poverty solutions. An important goal of the center is the training and development of a diverse group of researchers to move this important work forward.
The IRP has produced a number of webinars, which are posted on their YouTube channel. Areas of interest include both basic research on poverty and important current topics. For example, responding to COVID-19, they hosted a panel discussion, recorded and posted as a webinar, about housing and evictions during the pandemic.
While poverty is defined nationally, it is experienced locally. Prices, housing, access to health care, community services, and other factors differ dramatically from place to place, within states, and even within counties. A community-based approach to understanding poverty informs policy and programs, resulting in better outcomes and more efficient use of limited resources. The need for solutions that work at a local level means many Data for Good researchers are needed. The opportunities are endless and constantly changing to respond to new needs and circumstances. Developing and implementing poverty tech is one of the most important ways D4G is making a difference in the lives of people in communities across the country.
Getting Involved
In D4G opportunities this month, we are highlighting the student award programs from the Section on Statistical Computing and Section on Statistical Graphics, which are awarded at JSM. These competitions are not specific to Data for Good, but certainly offer a great opportunity to showcase your work.
The John M. Chambers Statistical Software Award recognizes software written by a student or in which a student was a collaborator. Both undergraduate and graduate students can apply.
There is also a student paper competition for papers in statistical computing and statistical graphics. The deadline for submissions is December 15.
Leave a Reply