A Date with Data: Stepping Toward Data Literacy
Nairanjana (Jan) Dasgupta is a Boeing Distinguished Professor at Washington State University, a fellow of the American Statistical Association, and chair of JEDI WNAR International Biometric Society. This year, she was named Woman of the Year at Washington State University for her tireless work to advance statistics and increase opportunities for women in the field.
Data is considered the new “liquid gold.” And phrases like “deep dive into data,” “data culture,” “data-based decision-making,” and “data-informed decision-making” have become ubiquitous among decision-makers. With the rise of these phrases, another phrase is also becoming fashionable: data literacy.
The dictionary says “data” = information and “literacy” = ability to read and write. So, in the most literal sense, the phrase could mean the ability to read and write with data.
ND: I enjoyed the M&M guessing game.
SM: Interacting with parents to learn about the community and its families.
DR: I enjoyed the family data poster presentation.
JN: I really had a good time with the two girls, knowing how smart they are.
PB: I really enjoyed playing games with the kids and talking to them about their futures.
JD: The car races with the kids.
KL: Watching the kids present the posters.
SM: All the kids’ impressive artwork. Angeles and Jinesh’s children’s interest in the data scrape activity.
DR: Talking about the birthday histogram with the families.
SC: I enjoyed the birthday game.
What was your high point?
ND: Jaime emailing me saying he wants to go to college.
KL: Helping George open up and engage with the activities.
SM: A 5-year-old participant (who could barely write his own name) writing out “los datos” (adorably misspelled) great big on his family’s poster board.
DR: Also helping George open up with the data scraping activity.
SC: While playing UNO, Josh said he will win and soon after he asked, “What is probability? How do you define that?”
Facilitators: David Rice, Justice Nii-Aytey, Shivani Sawant, Swarnita Chakraborty, Meghna Johnson, Kirsie Ludholm, Payton Bokowy, Molly Behrends, Freeman Chen, and Spencer Martin
There are gaps in access to training in data science, with unequal access across racial and ethnic groups. The issue of unequal access exists in all STEM fields, but it is exacerbated in data science, as unequal racial representation translates to algorithm writers who are nondiverse and unrepresented communities that are victims of algorithmic bias.
There are no easy solutions. The ultimate answer is increasing the pipeline by focusing on exposure to and interest in data from an early age. We can do this by introducing data concepts in elementary school and keeping them separate from mathematics.
Math is generally arithmetic in the early grades. Data literacy is more about number sense, storytelling, and visualization. A kindergartener may not be able/want to add 20 numbers in a minute (how math is often taught in underprivileged schools) but their favorite color of lollipop is something they can understand and relate to. They can understand that bringing more red lollipops to school (if that is the most common favorite color) is a data-based decision.
Teaching data as a concept outside math is a tough sell for math educators. There has been much research on incorporating data into math, but unless there is buy-in from teachers (especially in under-funded schools), it will be accessible to only a few groups. Math education is an established field; data education is in a fledgling state.
To advocate for data literacy, I spoke with math coordinators across various education districts in Washington (a tech-friendly state). The most common response I received was that data is already part of the curriculum and teachers are overstretched and underpaid. Essentially, “Thanks but no thanks. We do not have the funding or bandwidth to do what you are asking.”
Another oft-repeated response was that teachers run out of time before they get to the data chapter because they have to prepare students for testing.
As an alternative, I came up with a data literacy initiative. I would partner with community organizations, go to underserved communities, and lead “Date with Data” evenings. I wanted to target elementary children but invite the whole family in the hope of having a conversation about data.
The idea was to have an evening of fun and games while using the word data in all the activities. We served food, as it took away the burden of cooking dinner for the families. Having the entire family allows the parents to have child care for all their children. The parents and older siblings are crucial, as we want to talk to them about how data can be used and misused. The whole idea is to spike an interest in data, start a conversation about it, and create awareness within families and the community.
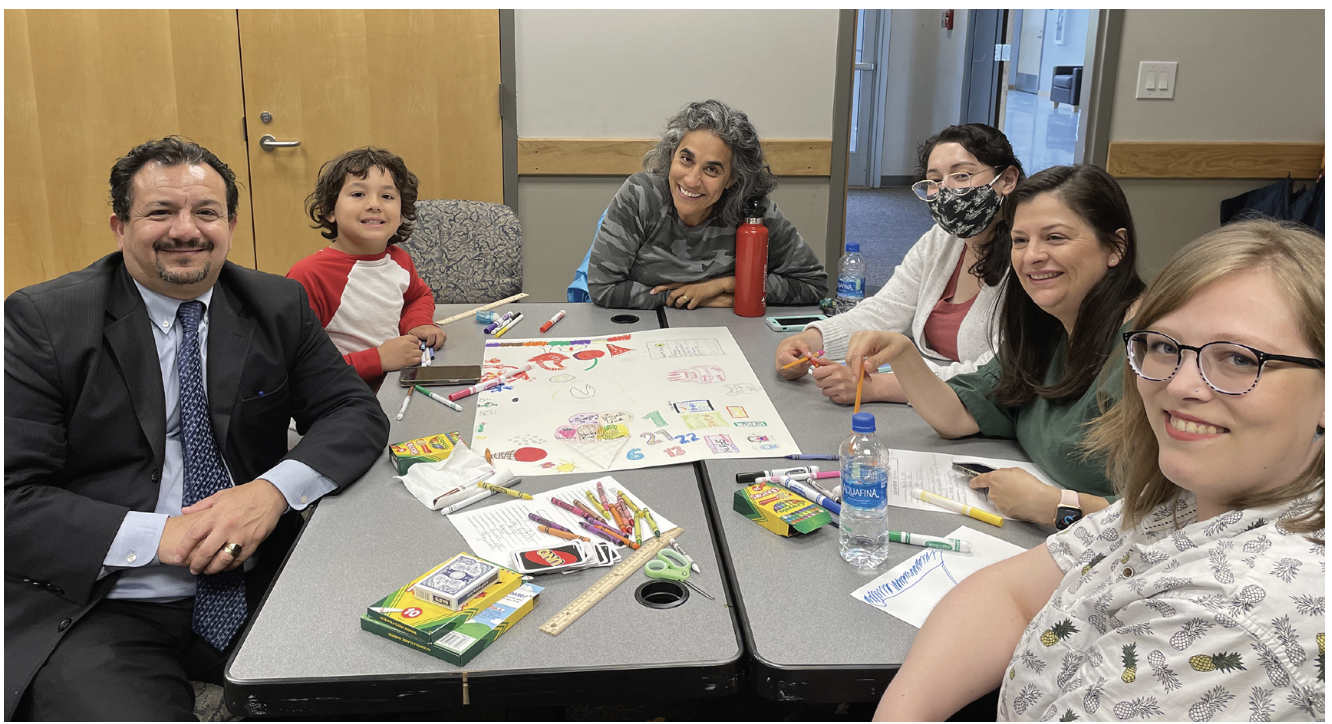
Seven-year-old George, who wants to design computer games, puts his family poster together with his family, friends, and facilitator Kirsie.
A Date with Data: Cashmere and Tri Cities
Both camps were held from 4:30 p.m. to 8:30 p.m. (after work for these communities) on May 19 and 21 in Cashmere (a large migrant community) and Richland (a large Latin community). The community partners were the Cashmere School District Federal Programs and the Hispanic Chamber of Commerce of Tri Cities. The second camp was funded by Amazon.
The program directors recruited families with elementary children. To act as facilitators for the camp, I recruited seven graduate students, three undergraduate students, and a high-school student with backgrounds in statistics, data analytics, comparative languages (fluent in Spanish), and psychology.
We had 35 attendees in Cashmere (11 children, 24 adults) and 23 attendees in Richland (13 children, 10 adults). The Cashmere event was in the elementary school cafeteria, and the Richland event took place at the WSU Tri Cities campus building. The attendance was lower in Richland because the building was on campus and a bit hard to find. It was also raining heavily that day.
With at least one facilitator and a mason jar filled with M&M candy. The icebreaker was guessing the number of M&Ms in the jar. Whoever guessed closest won the jar and M&Ms, but all the kids got some, as did the parents. They then filled out the following questionnaire:
My birthday is on ______
My favorite color is _____________
My favorite animal is ______________
My favorite time of the day is ______________
My favorite song is ______________
My favorite season is _______________
My favorite food is ___________
My favorite number is _____________
My favorite candy is _____________
My favorite ice cream is _______________
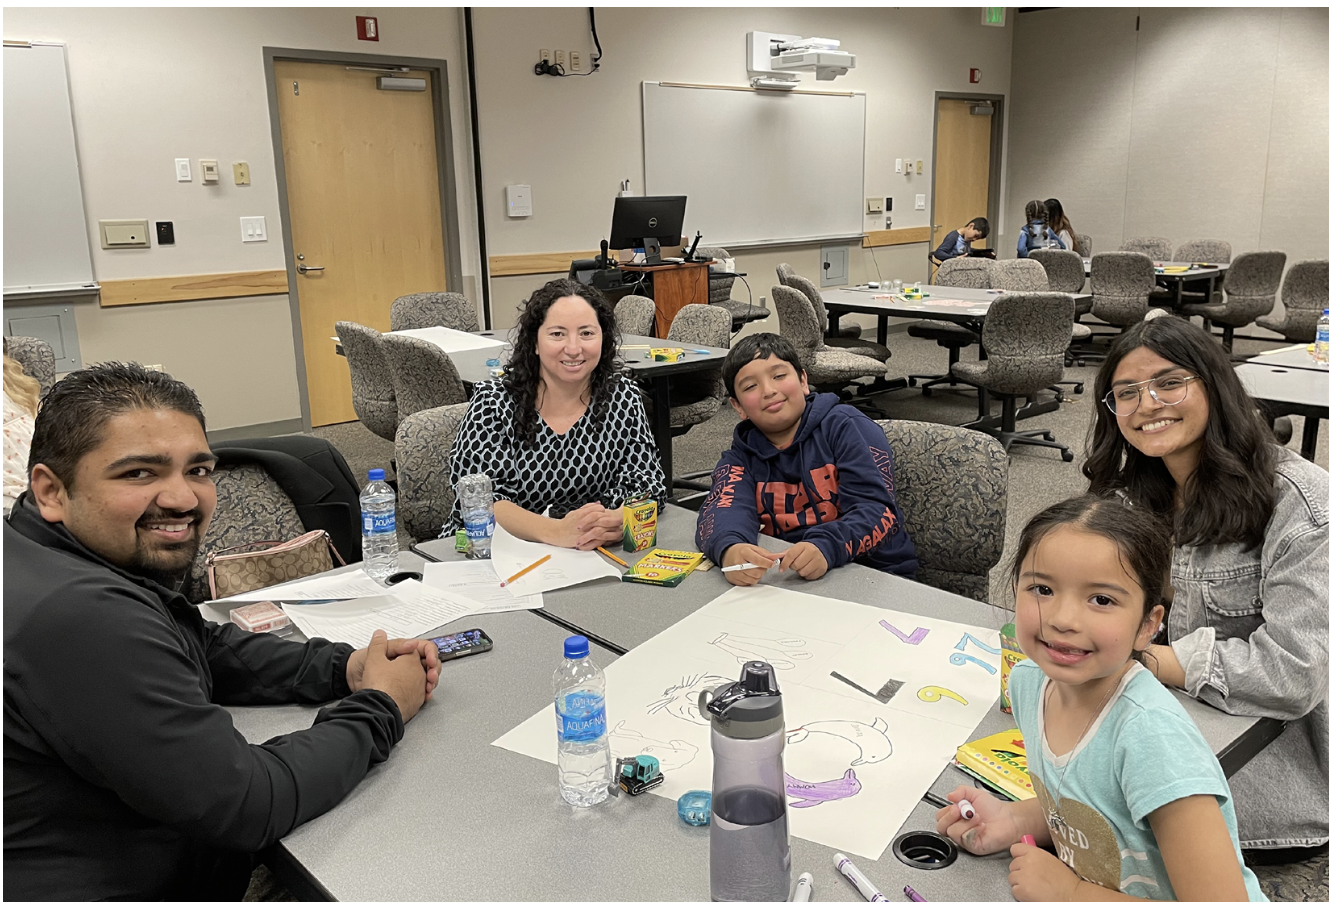
Josh and Divya make posters with their parents and facilitator Shivani.
Next, we had the kids design a game of putting table tennis balls into jars and coming up with a point system. We also had toy car races. The kids each picked a car and parents, kids, and facilitators predicted outcomes. We tried to reason why one toy car would be faster than another.
We played UNO and dice games and asked strategy questions. We emphasized to the kids that they were making “data-informed” decisions in their plays.
We plotted the sum of two dice using stickers. We talked about what was likely and what was not.
Dinner was a big attraction. In each case, we served a taco feast from a local business. In Cashmere, there were more adults than kids. Each facilitator talked with the parents and children during the meal about their future plans and why it was important to understand data in this world of automation.
After dinner, each family sat together and used the information we had collected to visualize their answers however they wanted. Most chose to focus on their favorite animals and drew them using their favorite colors. Parents and kids joined this activity with energy. Then, one kid from each family was invited to talk about their family’s “data story.” Most of the time, all the siblings came up to present, collectively holding the poster. Often, the parents came, as well. The parents seemed to have more fun than the kids, critiquing each other’s art.
The last activity was a “web scraping” from Twitter that we used to create word clouds. The kids and parents typed in their own search words. The kids searched words like “soccer,” “football,” and “Nemo,” while the parents searched words like “jobs,” “salary,” “Cashmere,” and “Tri Cities.” It was eye opening to the families to see how much can be done and how easily.
In the end, each family was given a goody bag and left smiling. Many asked us to come again in the fall. Alex, 10, told us he would “come to WSU and study data analytics” and drew the university logo on his poster. He said he would be the class of 2032. Then, Jaime, 14, said, “I want to go to college, but how do I go?”
Participants in both camps were asked if they wanted to do this again and 100 percent said yes. They also said they would bring more of their friends and family next time. We have two more camps planned this summer and, with funding, we should be able to do more in the fall.
The objective was to spark interest and engage in hands-on data literacy. The data from the pilot camps showed we accomplished that. I hope we can continue and really make data the fourth dimension of literacy.


 (No Ratings Yet)


Good initiative to make children aquented with Data literecy . Data is going to be another power in comming digital world !