Statistics, Biostatistics Degree Growth Continued in 2021
Surge in Master’s in Business Statistics Accentuates Demand for Data Science, Analytics Skills
Steve Pierson, ASA Director of Science Policy
The number of master’s degrees in business statistics awarded annually increased from 37 in 2010 to nearly 3,000 in 2021, paralleling the growth in bachelor’s and master’s degrees in statistics and biostatistics over the last couple decades. Similarly, the number of universities awarding the business statistics degree increased from 4 to 55 in the same period, according to the latest preliminary data release for 2021 degree completions from the National Center for Education Statistics.
The NCES 2021 degree data also shows the growth in undergraduate and master’s degrees in statistics and biostatistics over the last decades continues strong. For 2020 to 2021, bachelor’s degrees grew 7 percent to 5,340 (49 of which are for biostatistics) and master’s degrees grew 5 percent to 5,128 (917 for biostatistics), as seen in Figure 1. Doctoral degrees in statistics and biostatistics declined 6 percent to 689 (222 for biostatistics), consistent with the National Center for Science and Engineering Statistics finding that “the total number of doctorate recipients in the 2020–21 academic year declined by 5.4 percent from previous years.”
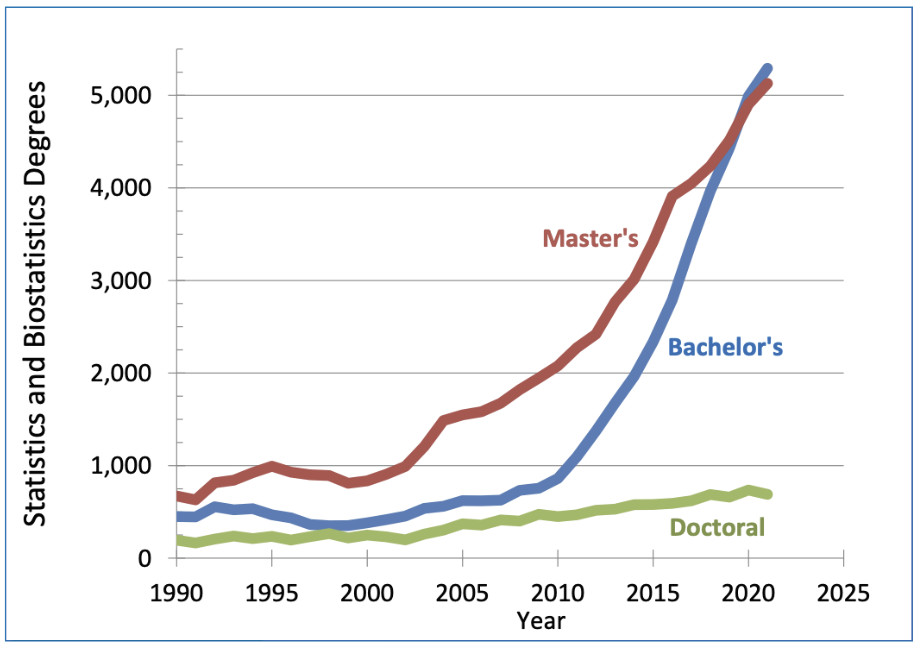
Figure 1: Statistics and biostatistics degrees at the bachelor’s, master’s, and doctoral levels in the United States for 1990–2021
Source: NCES IPEDS
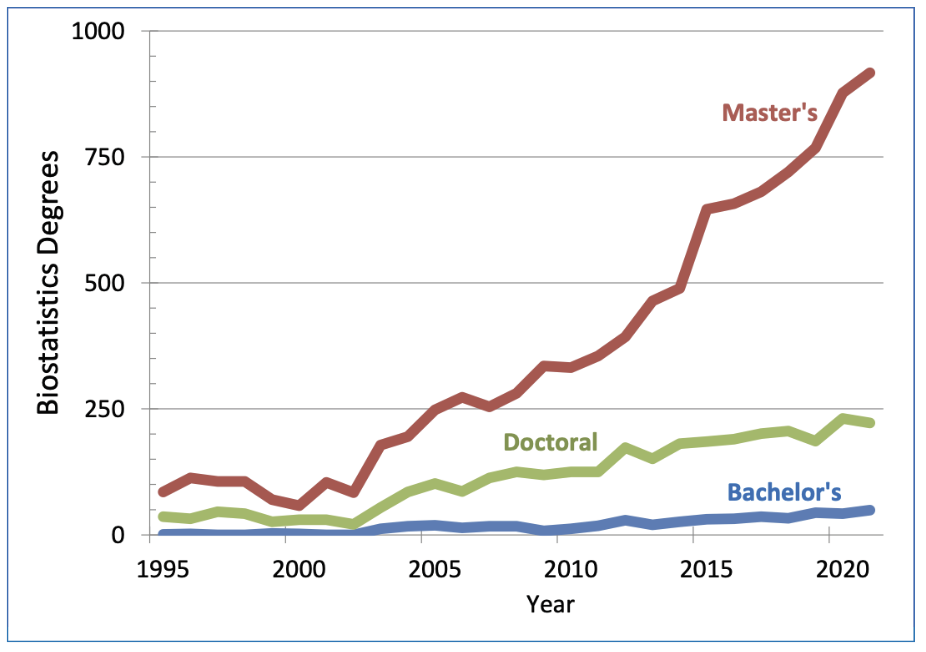
Figure 2: Biostatistics degrees by degree level awarded in the United States
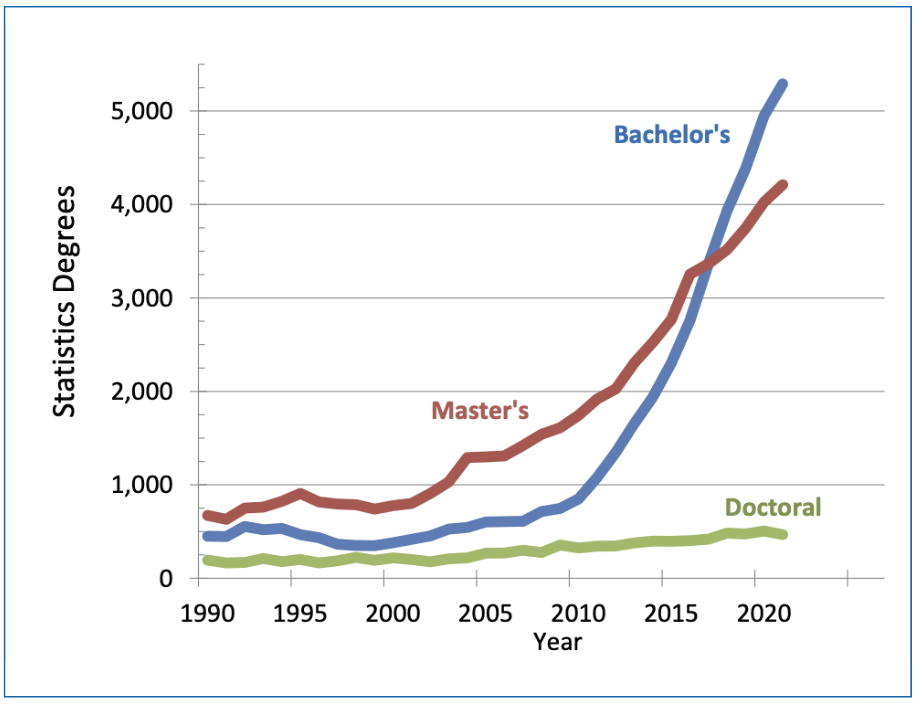
Figure 3: Statistics degrees by degree level awarded in the United States
While the growth of bachelor’s degrees is dominated by statistics—and the overall number of master’s and doctoral degrees is two to five times greater for statistics than biostatistics—the percentage growth in graduate degrees for both fields has been roughly similar since 2010, as seen in Figures 2 and 3.
The orders-of-magnitude growth in master’s degrees in business statistics is also seen by two other NCES Classification of Instructional Programs (CIP) codes used for master’s programs in data science and analytics since before the introduction of a CIP code specific to data science in 2020. As shown in Figure 4, the number of master’s degrees in data modeling/warehousing and database administration and in computational science has grown markedly over the last seven years.
The nascent data science CIP code, also shown in Figure 4, does not seem to have substantially affected the number of master’s degrees reported in the other three categories since its introduction for the 2020 degree reporting. A possible mitigating factor is that the Department of Homeland Security did not include the data science CIP code in its STEM Designated Degree Program List until early 2022. The list is used by DHS to determine eligibility for the 24-month STEM optional practical training extension.
The number of universities using the CIP code for data science is still modest. For bachelor’s degrees, the number increased from 13 in 2020 to 31 in 2021. For master’s, it increased from 12 in 2020 to 17 in 2021. The number of bachelor’s degrees awarded in data science was 84 in 2020 and 165 in 2021.
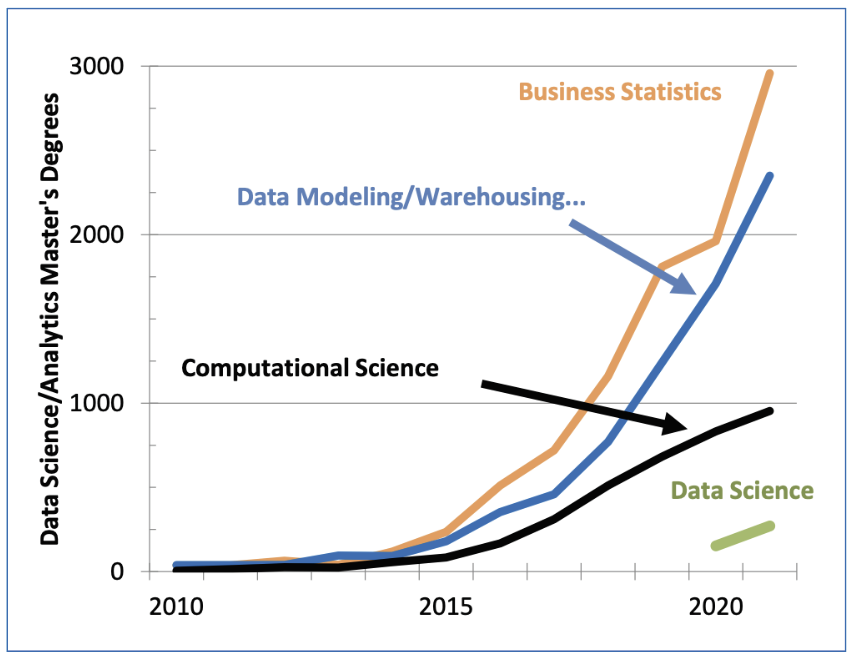
Figure 4: Master’s degrees awarded from 2010 to 2021 for three Classification of Instructional Programs categories commonly used by new data science/analytics programs. The graph also shows the number of master’s degrees awarded in 2020 and 2021 using the new classification code for data science.
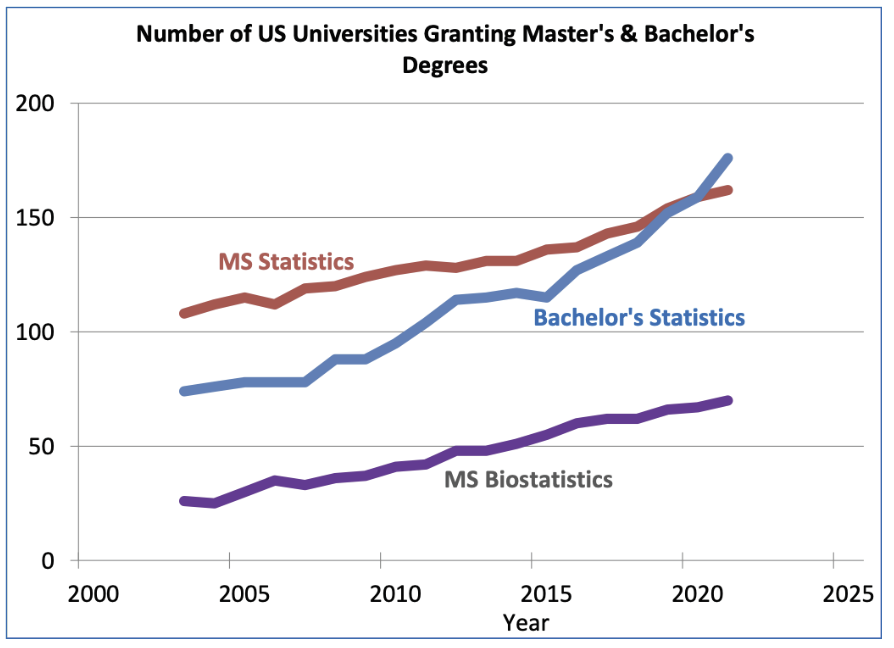
Figure 5: The number of universities granting statistics and biostatistics master’s and bachelor’s degrees
Compiled from NCES IPEDS data
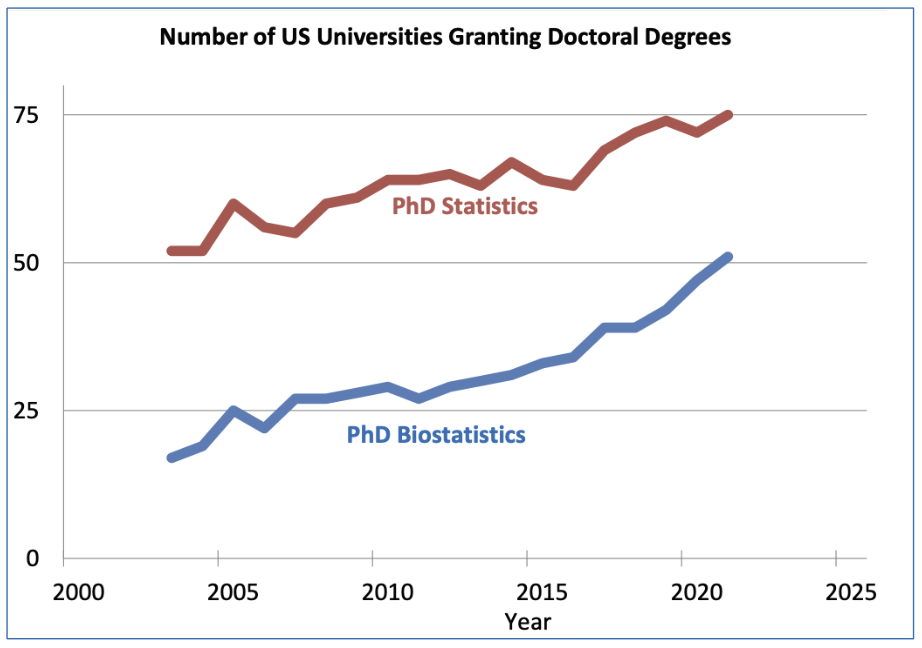
Figure 6: The number of universities granting statistics and biostatistics PhDs
Compiled from NCES IPEDS data
The increase in the number of universities granting statistics and biostatistics degrees also continues steadily, as seen in Figures 5 and 6. From 2020 to 2021, those granting bachelor’s degrees in statistics increased from 159 to 176, master’s degrees in statistics increased from 159 to 162, and doctoral degrees in statistics increased from 72 to 75. Master’s degrees in biostatistics increased from 47 to 51, and doctoral degrees in biostatistics increased from 67 to 70. Eight universities granted biostatistics degrees at the bachelor’s level in 2021.
The following 31 universities granted statistics and biostatistics degrees for the first time (at least since 2003) in 2021:
Bachelor’s degrees in statistics (14): Bradley University; Brigham Young University-Idaho; Eastern Washington University; Edinboro University of Pennsylvania; Husson University; Lake Forest College; High Point University; Northern Illinois University; The Ohio State University-Main Campus; University of Missouri-Kansas City; Villanova University; Washington University in St. Louis; Wayne State University; and William & Mary
Bachelor’s degrees in biostatistics (1): Indiana University-Purdue University-Indianapolis
Master’s degrees in statistics (5): Saint John Fisher College; University of Missouri-Kansas City; University of North Carolina at Greensboro; San Francisco State University; and Thomas Edison State University
Master’s degrees in biostatistics (3): University of Memphis; University of Nevada-Reno; University of Wisconsin-Milwaukee
PhD in statistics (3): Harrisburg University of Science and Technology; New York University; and University of Nevada-Reno
PhD in biostatistics (5): University of California-San Diego; Georgetown University; Saint Louis University; The University of Tennessee Health Science Center; and University of Delaware
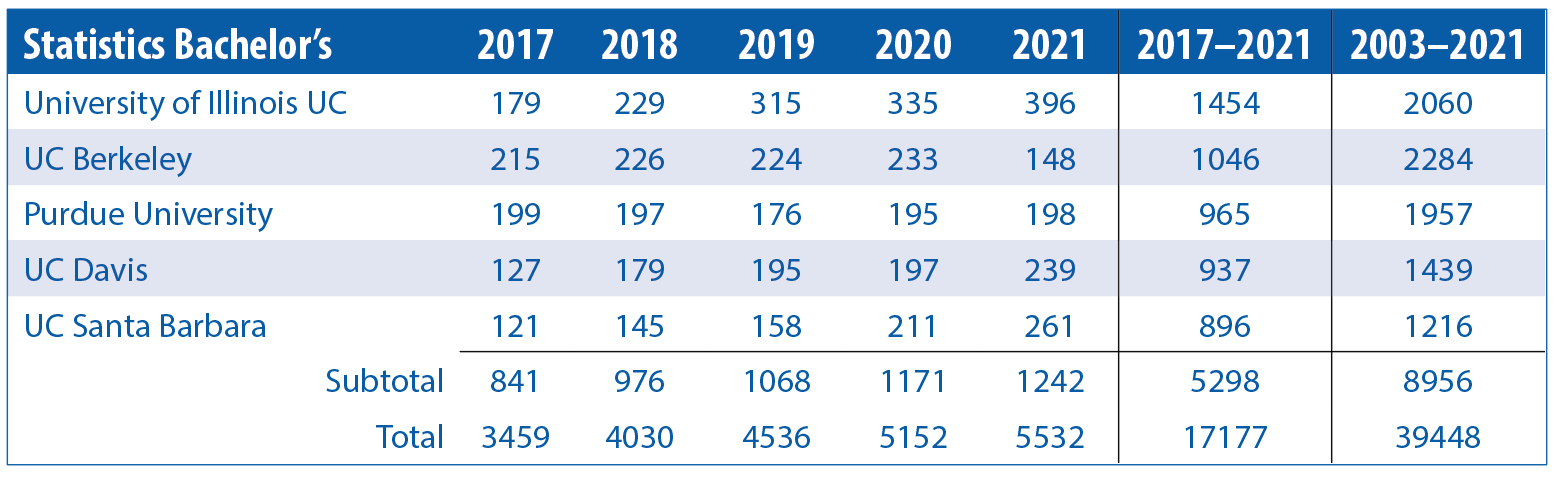
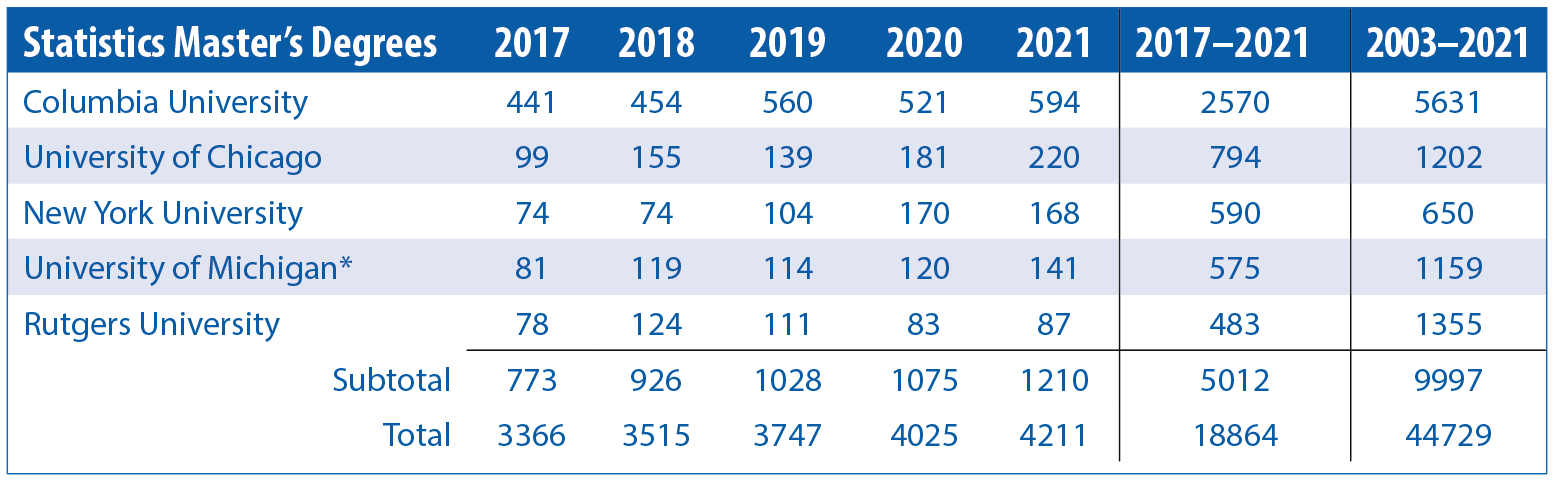
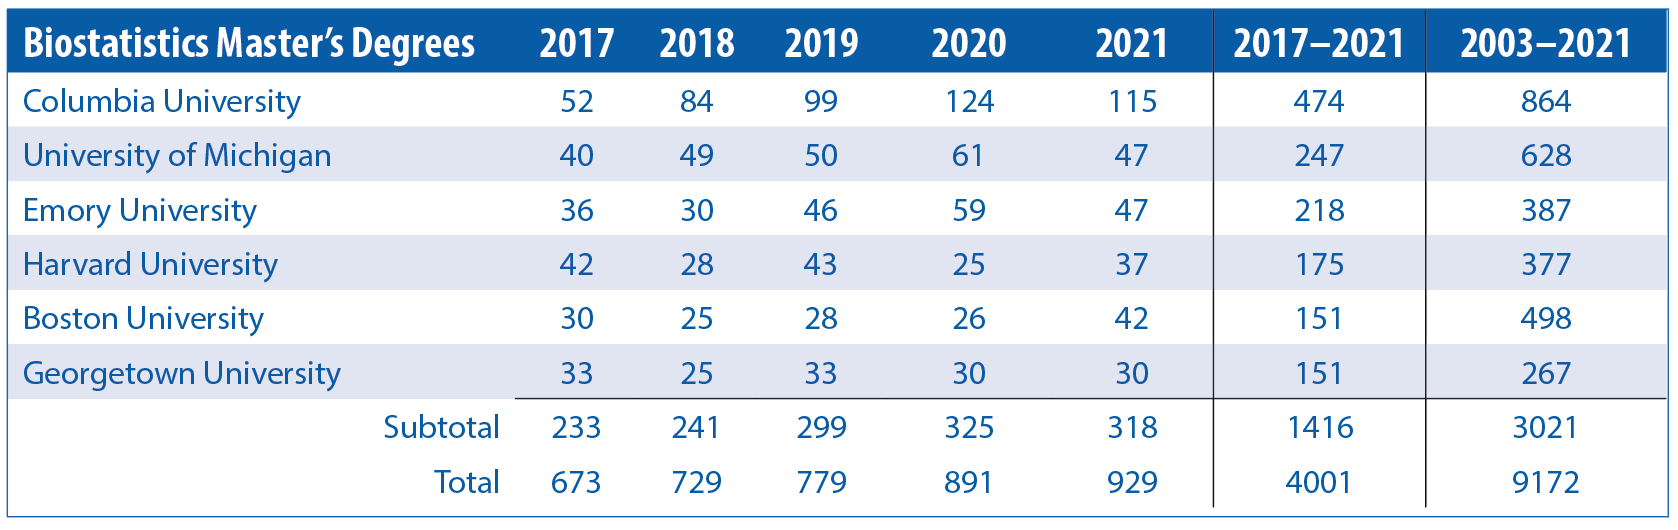
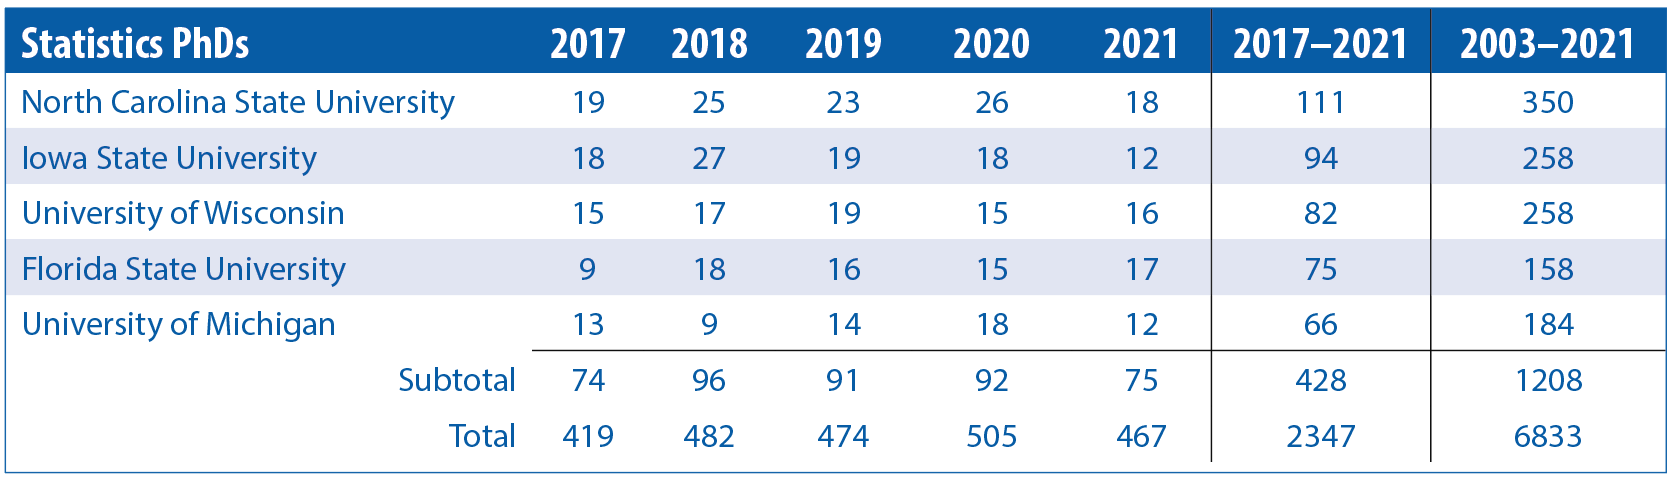
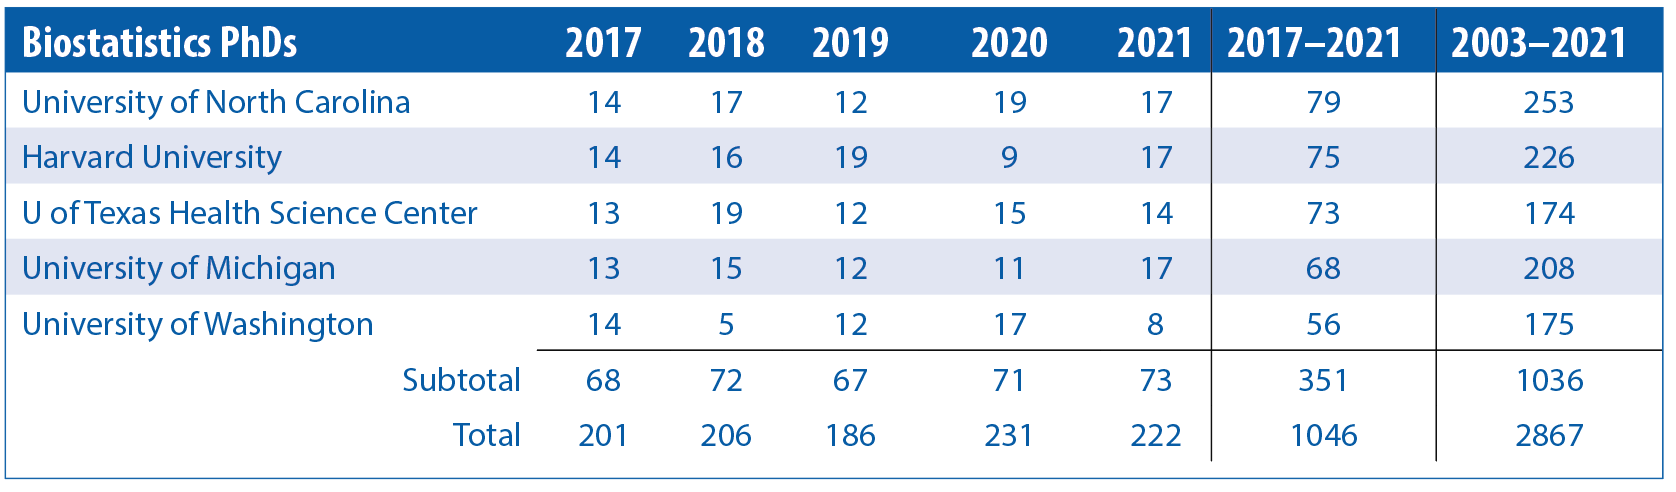
Tables 1–5—Top Five Universities Granting Statistics and Biostatistics Degrees for 2017–2021
* The University of Michigan master’s in statistics number in 2021 includes 86 in applied statistics.
Click on the tables to enlarge.
Demographics
Following our practice of alternating demographics updates, we look at the breakdown of degrees for race and ethnicity data and by nonresident aliens and US citizens or residents this year. Last year’s update, which was based on 2020 degree data, had figures for the percentage of statistics and biostatistics degrees earned by gender. The degree data files with degrees by gender have been updated with the 2021 data.
As shown in Figure 6, the percentage of master’s and doctoral degrees in statistics awarded in recent years to nonresident aliens is near 60 percent and 70 percent, respectively. For the same degree levels in biostatistics, it is in the range of 50–55 percent. The percentage for bachelor’s degrees in statistics ticked up a couple percentage points to 33 percent for 2020 and 2021 over the previous several years.
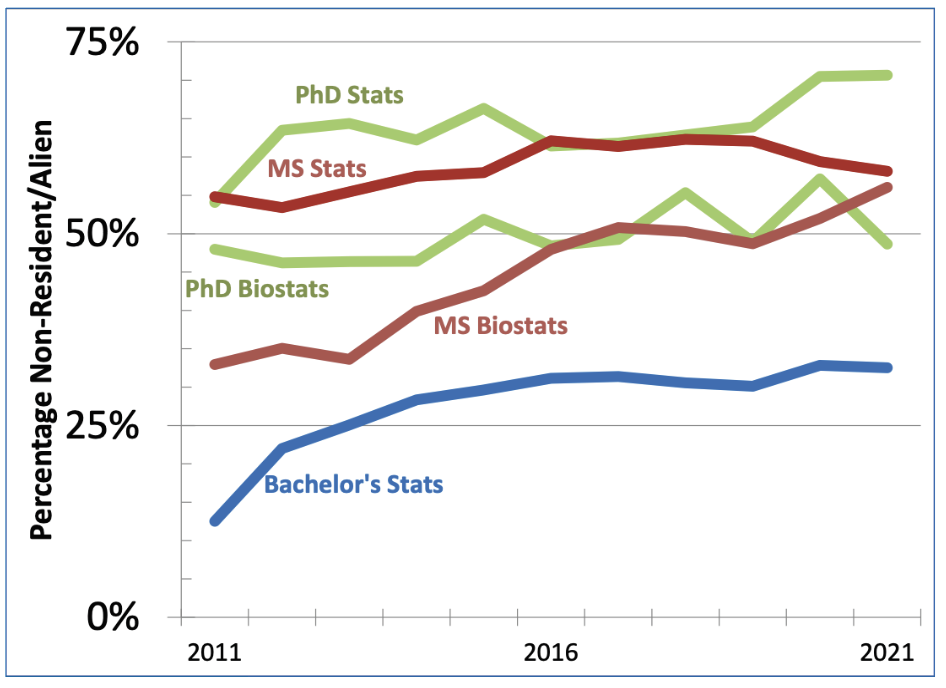
Figure 7: Percentage of statistics and biostatistics degrees earned by nonresident aliens
Source: NCES IPED
The NCES has race and ethnicity data for the degrees granted to US citizens or residents but not for nonresident aliens. Table 6 shows the race and ethnicity breakdown of the US citizens and residents averaged for 2011–2021. For the five degrees—not including biostatistics bachelor’s, for which the numbers are small—the percentage of degrees earned by those who report their race as American Indian or Alaska Native (AIAN) is essentially 0 percent. For those identifying as Asian (ASIA), the percentage is in the range of 18–27 percent. It is 3–6 percent for those identifying as Black or African American (BKAA). The percentage for individuals of Native Hawaiian or Other Pacific Islander (NHPI) descent is 0–1 percent. The percentage for those individuals who identify as white (WHIT) is 55–62 percent and, for individuals who report two or more races (2MOR), it is 1–4 percent. For those identifying ethnicity as Hispanic or Latino (HISP), the percentage is 4–8 percent. Finally, the percentage for those reporting race/ethnicity as unknown (UNKN) is 3–9 percent.
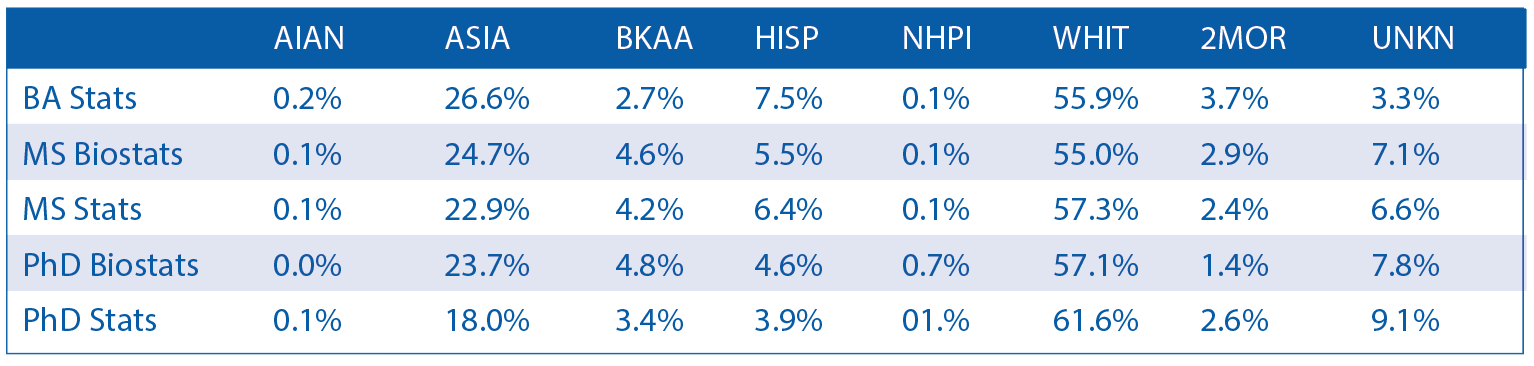
Table 6—Degrees Earned by NCES Race/Ethnicity Group and Degree Level, Averaged Over 2011–2021, as a Percentage of Degrees Earned by US Citizens or Residents
Source: NCES IPED
Click on the table to enlarge.
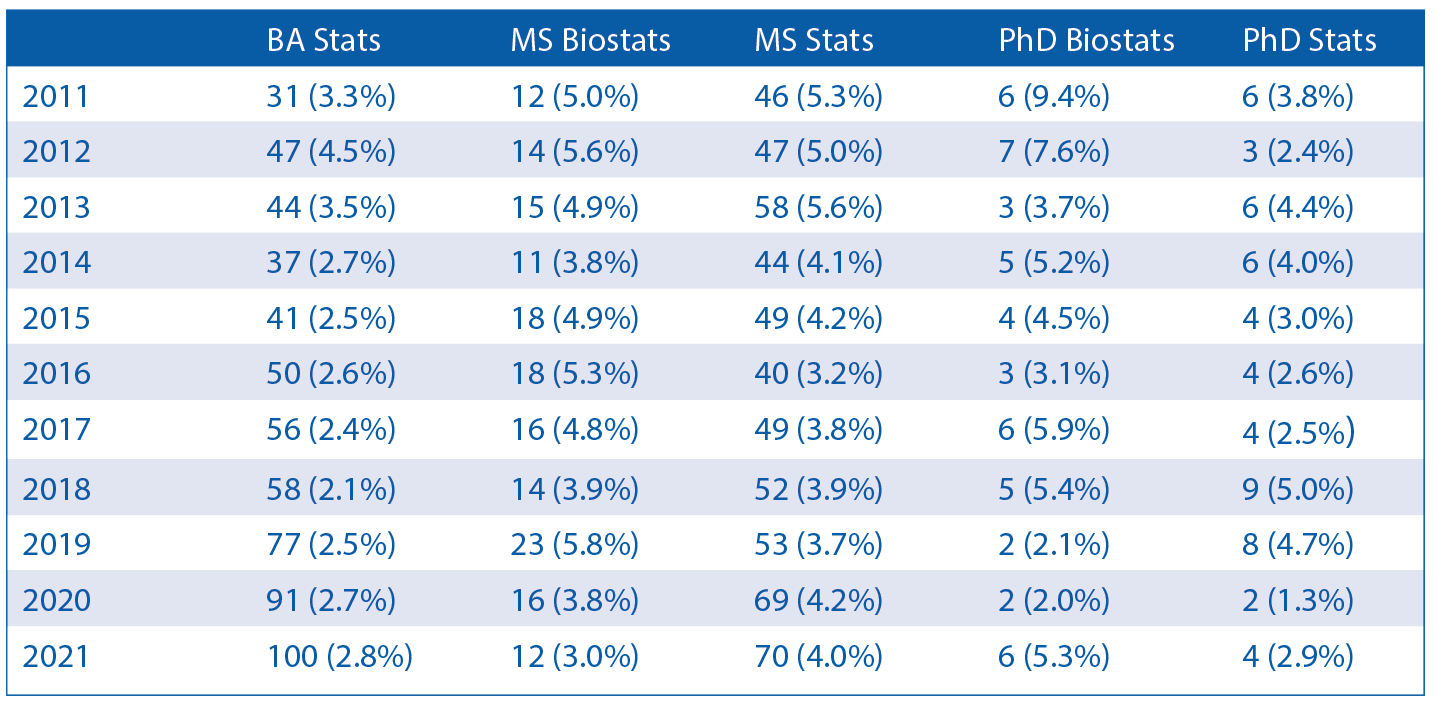
Table 7—Number of Degrees Awarded to African Americans or Blacks Who Are US Citizens or Permanent Residents by Degree Level, Along with Percentage of Such Degrees to US Citizens or Residents
Click on the table to enlarge.
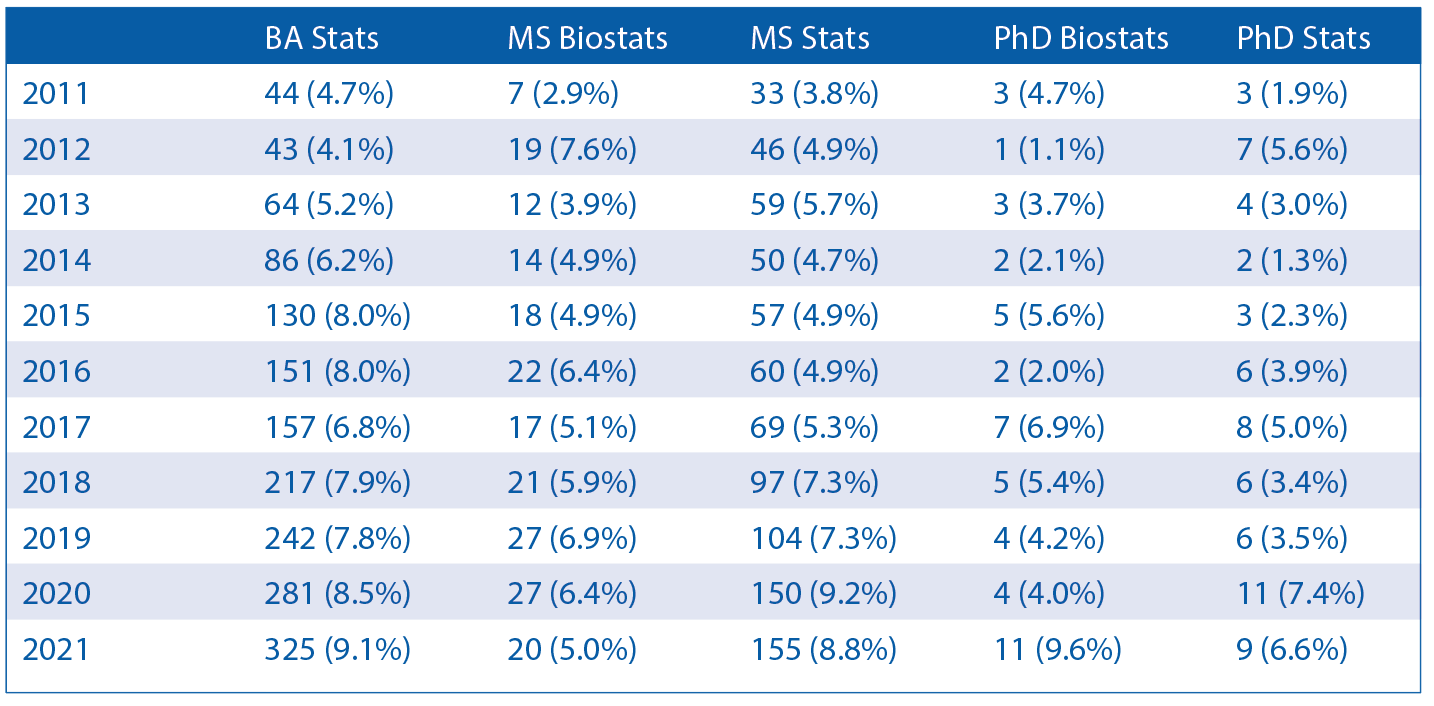
Table 8—Degrees Awarded to Hispanics or Latinos Who Are US Citizens or Permanent Residents by Degree Level, Along with Percentage of Such Degrees to US Citizens or Residents
Click on the table to enlarge.
To better understand the percentages in Table 6, consider Tables 7 and 8, which are time series for two under-represented minorities by degree level. For African Americans or Blacks who are US citizens or permanent residents, the number of doctoral degrees earned are in the single digits and seemingly a declining percentage of overall degrees awarded to US citizens or permanent residents. For the bachelor’s level, there seems to be an increase in the number of degrees, but not an increase in the percentage of overall degrees earned by US citizens or permanent residents. See Figures 8 and 9.
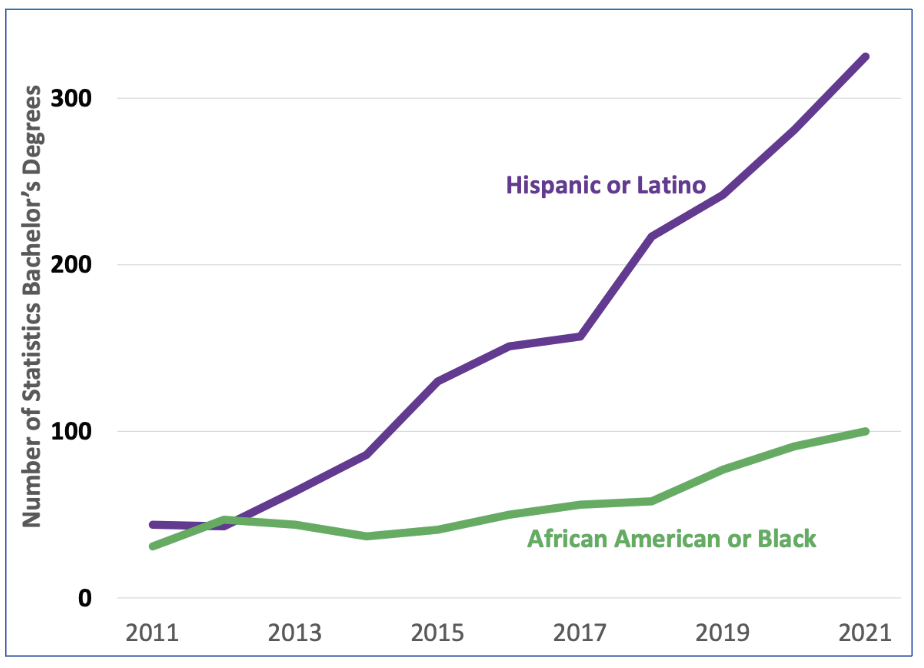
Figure 8: Number of statistics bachelor’s degrees earned by African Americans/Blacks, Hispanics/Latinos who are US citizens or permanent residents
Source: NCES IPED
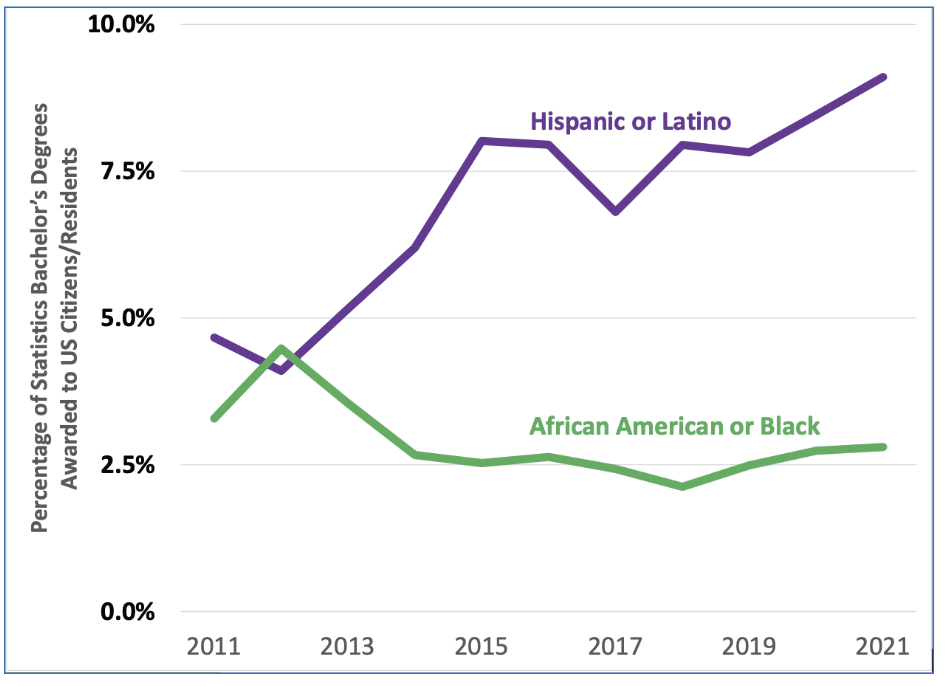
Figure 9: Percentage of statistics bachelor’s degrees awarded to US citizens/residents who are African American/Black or Hispanic/Latino
Source: NCES IPED
For Hispanics or Latinos, the doctoral numbers are generally in the single digits with little or no movement over the decade. For bachelor’s and master’s in statistics, the numbers seem to be increasing and, as a percentage, also seemingly increased over 2011–2013, as shown in Figures 8 and 9 for bachelor’s degrees.
Comments and questions may be sent to ASA Director of Science Policy Steve Pierson.
For more information, view these and related data—including the universities awarding master’s degrees in business statistics.


 (No Ratings Yet)


An interesting exercise is to compare the degree profiles by
years with a few hardware release reference points:
Compaq and Apple released their first laptops, 1988-’89.
Microsoft released mouse and trackball technology in 1991.
IBM released the first ThinkPad in 1992.
By 2008, laptops exceeded desktops in sales.
Arguable, about 1990 is where most of the sales events occur.
Within a decade the degree divergences become notable.
For what it’s worth, I never heard of biostatistics until I
was recruited to join my former group. That was 1986, when I
was a statistics grad student.