

Graduates Generous with Advice for Current, Prospective Students
Steve Pierson, ASA Director of Science Policy, and Kiana Moore, ASA Policy Consultant
With the emergence of data science, machine learning, and AI, much has changed in the job market since the American Statistical Association’s first follow-up survey of bachelor’s graduates in 2017. This fourth survey of the graduating class of 2023 covers many changes, as well as considerable consistency.
- Besides median starting salary of the respondents for each cohort increasing from $56,000 for the class of 2016 to $72,000 for the 2023 class, our survey now covers use and development of machine learning and AI.
- Handshake is more widely used in job searches, and there are fewer mentions of Glassdoor; LinkedIn seems to be maintaining its utility and use.
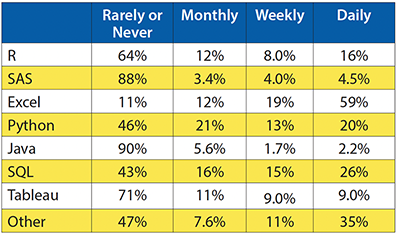
- Python and SQL are more widely used, while SAS is a bit less so.
- We no longer query the use of JMP, Minitab, and SPSS; PowerBI seems to be on the rise and is likely to be included in our next survey.
- We’re also documenting the use of certificate and related courses students and graduates use to augment their statistical, computing, and data science courses.
- Job satisfaction and diversity is as high as ever, as well as the importance of teamwork; the wide use of Excel; and the value of extracurricular experiences like internships, research, and coops.
- Respondents are enthusiastic and helpful about sharing in open-ended questions asking about their job searches, what undergraduate experiences likely helped, what they would have done differently, and what advice they have for current students.
The surveys provide snapshots of the job market experienced by graduates during the dramatic growth in statistics degrees earned annually over the past decade—nearly a three-fold increase for bachelor’s degrees, as reported in the November issue of Amstat News—and allow insights into how student interests, the job market, and curriculum may be changing.
The results are intended to be helpful to three main audiences: current statistics students to inform both their remaining studies and planning for post-graduation; potential statistics students as they decide on a major(s); and faculty and administrators as they advise students, design curricula, and allocate resources. To be especially helpful to the third audience, department-specific reports are provided to departments with enough responding graduates. This year, 24 departments received such reports.
Survey Respondents Overview
Participating in this year’s survey were 334 graduates from 37 universities. The survey was distributed in spring 2024 and asked about employment or graduate student status as of March 4, 2024. These numbers are a decrease from the 2021 survey of the 2020 graduates, when 425 graduates from 57 universities participated. The number of 2023 bachelor’s graduates in statistics and biostatistics was 5,547, as reported by the National Center for Education Statistics for the 2022–2023 academic year.
Of the 284 individuals who responded to the gender identity question, 109 selected woman, 171 selected man, and four preferred not to say. The percentage who are women, 38%, is close to the 39% in the NCES data.
For citizenship data, where NCES data shows 27% of 2023 bachelor’s degrees going to nonresidents, only 14% (41) in the ASA survey reported being non-US citizens (25 from China) and 86% (244) reported being US citizens. These numbers follow closely those for the combined numbers from the survey of the 2016, 2017, and 2020 graduates.
The universities with the most bachelor’s degree recipients participating in the survey were Brigham Young University (62), University of Virginia (35), University of Michigan-Ann Arbor (33), The University of North Carolina Chapel at Hill (31), University of California, Los Angeles (27), Michigan State University (18), Cornell University (13), Columbia University (12), and University of Florida (11).
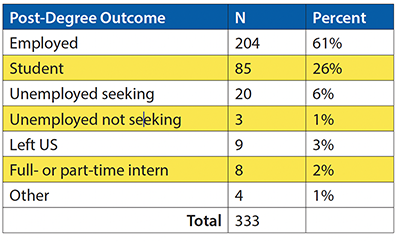
After their undergraduate studies, more than twice as many respondents received jobs as continued their studies, roughly the same as for the classes of 2016, 2017, and 2020. See Table 1, which also provides information about students who are unemployed, left the US, and have internships. The 2023 number of unemployed and seeking a job is 6%, larger by a percentage point from the Class of 2020 respondents. Eighty-eight listed themselves in full-time degree programs, and another 59 said they were planning to begin a degree program in the future.
Employed
The respondents who obtained jobs seem to be well paid and generally satisfied with them. They also work for a diverse and large number of employers with generally unique job titles in a variety of sectors. The median salary for those reporting it was $72,000. While this amount is more than that of the bachelor’s 2020 cohort median of 69,900, these salaries are a small sample of the total population and should be analyzed with caution. Salaries tend to depend on the bachelor’s specific field and work sector. For similar reasons, we also don’t recommend drawing conclusions about gender salary comparisons.
For an approximate comparison of salary with other majors, a graph for 2021 and 2022 physics bachelor’s graduates from the American Institute of Physics website shows an average salary of approximately $65,000. The most recent data from the National Association of Colleges and Employers released in September 2024 shows an average starting salary of $91,000 for 2023 computer and information sciences graduates, $80,000 for engineering graduates, and $80,000 for mathematics and statistics graduates. For all 2023 college graduates, they reported an average starting salary of $64,000.
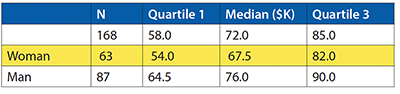
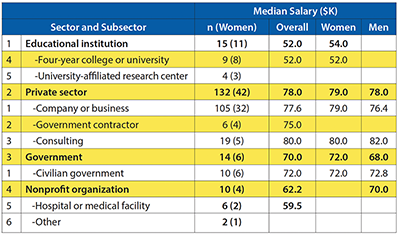
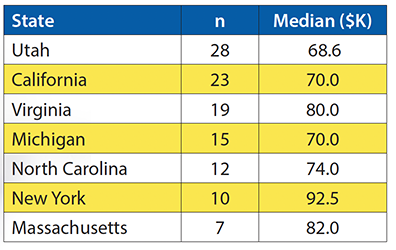
The next three tables show the median salaries as broken down by specific bachelor’s field (Table 3), employment sector (Table 4), and state (Table 5). N is the total number of respondents from the class of 2023 who reported that category, n is the subset who reported salary, and the number in parentheses is the number of n who are women.
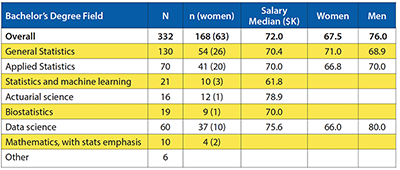
Respondents in the specific fields of actuarial science and data science had a higher median than those in other fields. Of the overall 332 (N) who characterized their undergraduate field (Table 3), 60% listed general or applied statistics and 18% listed data science.
The large majority of those who went directly to the job market are in the private sector, which is the sector with the largest median salary for the 2023 respondents (Table 4). Of those in the private sector, most worked for a company or business. Many of the job titles for the 2023 graduates employed in March 2024 and the companies employing them are available in the additional materials for this article and may provide further insights. By state, the highest median salary (for n>6) was in Massachusetts, New York, and Virginia, as shown in Table 5.
The majority (58%) of employed graduates received one job offer, 26% received two, 8% received three, and 5% received four or more. Fifty-eight percent of those responding thought their statistics or statistics-related major was very influential in securing their current position; 25% responded it was somewhat influential.
The responses from bachelor’s degree graduates about their job search experiences highlight a variety of outcomes, with many emphasizing the importance of internships, networking, and persistence. Some respondents secured positions through internships at the same companies they worked for during their studies, while others struggled with the competitive job market, often applying to numerous jobs before finding success. LinkedIn, Handshake, and Indeed were popular tools. Here are select responses (with all responses posted in the supplemental material):
- “Networking was a big help for me. I applied to a lot of jobs on LinkedIn, but only heard back from companies I had connections to. A friend in the stats program referred me to the position I’m at now.”
- “I used Handshake during October of my senior year. Through Handshake, I was able to schedule in-person interviews on campus. Having university-hosted interviews helped me network with the right people in companies I was interested in.”
- “I participated in an internship my junior year of college, after being contacted by a recruiter on the job site Handshake. I was then offered to return to the company full time a month after my internship ended. I accepted and did not really apply to other full-time positions afterwards.”
The responses about experiences, training, or qualifications that could have helped bachelor’s degree graduates secure a position highlighted a strong emphasis on technical skills, internships, and research opportunities. Many respondents noted the importance of specific skills such as SQL, Python, database management, and data analytics, while others pointed out the value of internships and research during their degree programs.
Overall job satisfaction was high, with 80% of respondents expressing satisfaction across several categories. Specifically, 44% reported being satisfied with their position (38% very satisfied); 41% with salary and benefits (31% very satisfied); 34% with job security (44% very satisfied); 32% with opportunity for advancement (25% very satisfied); 37% with intellectual challenge (32% very satisfied); and 42% with level of responsibility (25% very satisfied).
There were 140 unique job titles among 195 job titles reported. (The lists of job titles and companies are available in the supplemental material section.) The most common job titles were data analyst (16), actuarial analyst (12), data scientist (8), and analyst (6). There were also seven titles that were variations of software engineer. These five titles were also the most common job titles for the previous cohorts. Listed were 161 unique employers (of a total 189). Deloitte and Goldman Sachs were the only companies employing more than two of the respondents.
The 163 graduates who categorized themselves as employed and provided the state were employed in 28 states and the District of Columbia.
Respondents were also asked about frequency per month of formal presentations, with 42% saying none, 29% saying once, and 15% saying twice.
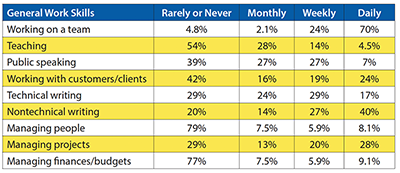
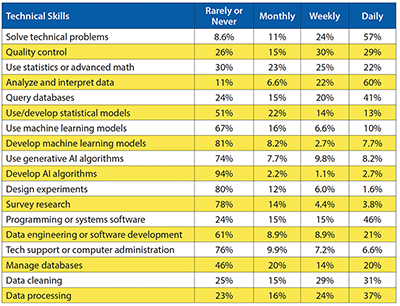
The questionnaire also asked those employed about the frequency of many skills they use in their work. For interpersonal, communication, and management skills (Table 6), teamwork is the most often used by far, followed by nontechnical writing and project management. The most-used technical skills, as shown in Table 7, are data analysis and interpretation, technical problem solving, programming or systems software, querying databases, and data processing. Data cleaning, quality control, use of statistics or advanced math, and data engineering or software development are in the next tier of most-used technical skills. Respondents also mentioned data visualization and app development.
The survey also asked the tools/languages new bachelor’s graduates use and with what frequency. The most frequently used at least weekly were—in descending order—Excel, SQL, and Python (Table 8). In the “other” category, among the 27 tools named, the most common were PowerBI (10), C# (3), and AWS (3).
Postgraduate Study
Of the 88 respondents who reported they were full time in a degree program, 27 specified a statistics program, seven a biostatistics program, 15 a data science program, and 40 others in 15+ other programs. Fifteen of the graduates were enrolled in doctoral programs and 62 were enrolled in master’s programs, though 21 of the students intend to earn a doctoral degree.
For the 21 full-time students who reported a stipend, the median 9-month stipend was $26,100. Twelve of these people had a summer stipend for which the median was $8,500.
Undergraduate Study
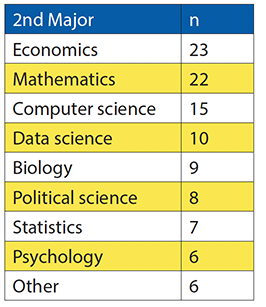
A sizable portion of the graduates participating had busy academic schedules with both their courses and non-classroom engagements with statistics. Roughly a third of respondents (119) said they graduated with a double major, with the most common companion majors being economics and mathematics (Table 9). One hundred fifty-three graduates (47%) indicated they minored in a field, the most common being data science (28), computer science (16), business administration (14), mathematics (13), economics (8), biology (6), environmental science (5), and psychology (5).
To probe the outside-the-classroom learning experiences of undergraduates, the survey asked about internships, research, and capstone projects and how they regarded such experiences for their education and career. One hundred ten graduates said they did a thesis or capstone project, 162 did an off-campus internship or industrial co-op, 120 did on-campus research, 53 did a DataFest or hack-a-thon, 23 did a National Science Foundation Research Experience for Undergraduates, 27 did other summer research on another campus, 60 did a conference presentation or attended a conference, 63 did a graduate course, 47 did an on-campus internship, 22 did consulting or freelancing; and 71 served as a teaching assistant.
For these experiences, graduates were asked, “How do you feel your above experience(s) affected your current situation?” The open-ended responses, available to view in the supplemental material, seemed to be overwhelmingly positive about how their undergraduate statistics experiences outside of regular classroom assignments had a significant impact on their careers and academic advancement. These experiences provided practical skills, enhanced résumés, and real-world applications of their academic knowledge.
The following are a few of the nearly 200 responses:
- “My internship led to a job offer, and without the valuable experiences I gained from the research I conducted, I would not have been able to land my internship.”
- “They enriched my skills to be able to apply what I had learned in the classroom to real-world problems.”
- “Being a TA is [a] good experience in teaching, public speaking, and general communication, as well as making you more of a subject expert in whatever class you’re teaching.”
- “My internships allowed me to experience corporate life before graduating. Starting my first job, I felt completely prepared.”
The responses from bachelor’s degree graduates about what they would do differently regarding their undergraduate education reflect a variety of perspectives. Many emphasized the importance of gaining more technical skills, such as programming and machine learning, or pursuing additional majors or minors. Some students would have chosen differently with respect to their field of study and concentration. For example, some would have added more applied courses while others would have chosen a different STEM-related major or minor, including data science, business analytics, computer science, and computational math. A significant number of respondents wished they had focused more on internships, research opportunities, and real-world experience, while others felt content with their educational choices.
Responses among the 180 included the following:
- “Try harder to get involved! Talk to faculty/grad students about opportunities and try harder to obtain a summer internship or research experience.”
- “Pay more attention on coding and interpreting skills. Also, more actively looking for internship”
- “I would have attempted to go into research at an earlier time and gone to more office hours to connect with my professors.”
- “Find ways to learn how to convey technical information in a non-technical manner.”
Many of the respondents also commented they wouldn’t have done anything differently in their postsecondary education.
The advice provided for current statistics students tracked with the responses above about what graduates would have done differently as students. The responses provided advice and additional comments for current students in statistics, biostatistics, and related fields, focusing on practical skills, networking, internships, and the challenges of the job market, as reflected in the following select responses:
- “Ask for research opportunities or go to a university where research opportunities are available for undergraduates.”
- “Find as many opportunities to practice statistical skills and apply them to your résumé. In general, be able to talk about the math, it’s not enough to just be able to do the math.”
- “Go out of your way to constantly learn more things. Take courses to gain new tools, such as Excel, Python, SQL. Anything to help your résumé.”
- “Network and minor in computer science. Also, work on projects and present them to stakeholders/peers.”
- “Focus on understanding the current DS/stats landscape and building skills outside of your coursework.”
Students were generally quite positive about how well their undergraduate program prepared them. Ninety percent agreed or strongly agreed their program prepared them to effectively analyze and interpret data critically using statistical models, and 81 percent agreed their program prepared them to effectively communicate both orally and in written form results of statistical analyses to a variety of audiences. Ninety percent agreed their program prepared them to effectively analyze and interpret data critically using computational methods.
A sizeable percentage, 26%, said they participated in any certificate or related non-university programs to augment their statistical or data science skills. The 60 responses include Coursera, DataCamp, and a plethora of other options listed in the supplemental material.
Regarding their job search, students generally took advantage of help from their statistics department and faculty or the on-campus career counseling center. Fifty-seven percent of those responding said their statistics department or the faculty provided career guidance, and 42% said they used their on-campus career counseling center. The responses regarding experiences with on-campus career counseling centers from bachelor’s degree graduates were varied. Some found the services useful for résumé building and job fairs, while others thought the support was limited or generic. The overall sentiment was that the career centers provided some value but often did not make a significant impact on job placement.
Feedback Wanted: To accurately track changes in the job market for statistics bachelor’s graduates, let ASA Director of Science Policy Steve Pierson (spierson@amstat.org) know how to update the questionnaire. He also welcomes input about the frequency of the survey and all its aspects—from questions and administration to reporting and dissemination.
The survey was conducted by the American Institute of Physics research team. The ASA provided department names and contacts for the departments granting statistics or biostatistics degrees according to its records. For both the bachelor’s and master’s graduates, the research team reached out to 157 departments, receiving the names and contact information for 1,721 bachelor’s graduates, who received up to four invitations to participate in the survey. Departments that did not provide contact information for graduates were asked to distribute survey invitations to their alumni.
Supplemental Material
Questionnaire
Participating Universities
Job Titles
Career Center Use
What I Would Have Done Differently
Advice for Current Students, Additional Comments
Job Search Experiences
Experiences That Would Have Helped My Job Search Experience
Certificates and Non-University Programs
How Research Experience, Thesis, Internship, or Related Affected Current Situation
Other Technical Skills
Response Summaries
Leave a Reply