
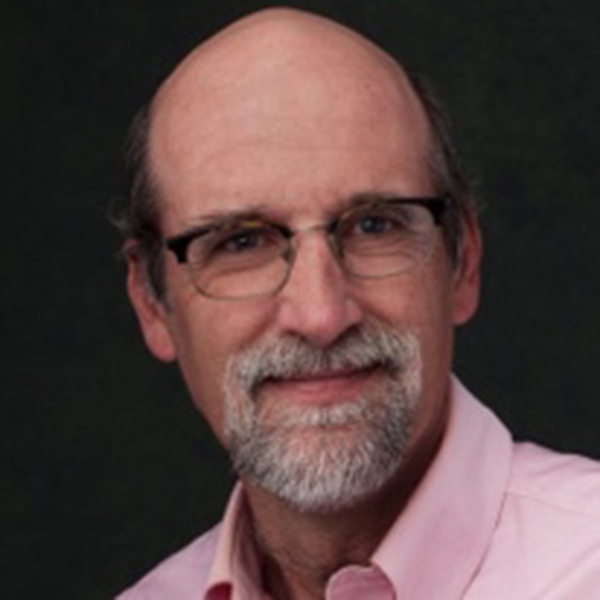
Jeff Witmer
Professor of Statistics, Oberlin College
Background
Where did you grow up?
I spent my childhood in Wisconsin, first on a farm five miles west of Madison, then in the city of Middleton (right next to Madison), then in La Crosse, where I attended high school and college.
What or who influenced you to become a statistician and a professor, and why Oberlin College?
I was a mathematics major as an undergraduate, and I liked the probability and statistics courses I took among 17 total courses that were part of my major. I sampled a lot of mathematics and statistics, and I liked the statistics courses best. My father was an academic, the assistant chancellor of the University of Wisconsin-La Crosse, when I was a student there, and I always liked teaching and explaining things to people.
After graduate school, I took a tenure-track job at the University of Florida, but my wife didn’t like the heat and humidity, plus we were far from family—although we had a lot of visitors during winter months. On top of that, my salary was rather low, so we considered moving. We looked at several Big Ten schools plus Oberlin College, which we only considered because it is in my wife’s home state of Ohio. When I interviewed at Oberlin, I fell in love with the place, the people, the history, the commitment to social justice. I knew right away that Oberlin would be a great school for me.
Isolated Statistician
According to the history of the Isolated Statisticians group, you and Don Bentley from Pomona College posted a note on a bulletin board at JSM 1991 in Atlanta inviting statisticians teaching at small schools to a meeting and 14 people showed up. How did you and Don come up with the idea for the Isolated Statisticians group?
Don and I were at a meeting of the Statistics in the Liberal Arts Workshop, talking with a few other liberal arts college statisticians about the plight of working within a mathematics department as the only statistician, often misunderstood by others in the department. We thought it would be good to get some people together for a wider conversation—and commiseration—about being isolated. The Joint Statistical Meetings was just a few weeks away and we hastily made plans for that first meeting, including reserving a room after JSM sessions had ended for the day. We didn’t know what to expect and were happy that as many as 14 of us showed up, given that there had been almost no time to advertise.
How has the group grown since those early days? Does it still have a listserv or other way to communicate throughout the group, and are you still actively involved?
The listserv is the main feature of IsoStat. We have an in-person meeting at JSM each year, but mostly we share ideas via the listserv. I have been running the listserv since the beginning, which mostly means collecting email addresses and dealing with the occasional technical problem. We passed 200 members in 2006, 400 members in 2017, and 600 members in 2024. Today, we have 656 members, almost all of whom are ASA members, but we are open to non-ASA members, as well.
I might mention that most of us are academics, but a handful of our members are statisticians who value education and perhaps teach others about statistics as part of the consulting work they do but do not hold faculty positions.
In statistics, an approximate answer to an exact question is much more valuable than an exact answer to an approximate question.
What challenges do statisticians at small or isolated institutions face? How does the group help address these?
We define “isolated” quite loosely, and many of our members today have one or two or more departmental colleagues, so, strictly speaking, they are not isolated. But we don’t speak strictly when welcoming new members. Even when there are multiple statisticians on a campus, the chances are they are housed in a department dominated by mathematicians, and those two groups see the world differently.
This is partly captured in the realization that, to a mathematician, what matters is finding an exact solution to a problem, even if the problem being solved is not the original problem of interest. In contrast, a statistician needs to address a client’s question as best they can. We can’t say to the client, “I can’t solve your problem, but I have a great solution to a related question (that I wish you had asked).” In statistics, an approximate answer to an exact question is much more valuable than an exact answer to an approximate question.
When I’m teaching or consulting, I like to be able to get ideas and help from others, and the IsoStat listserv provides a forum for that to happen. Someone will post a question to the list and, within a couple of hours, there will be two or three or more thoughtful responses from others who have wrestled with the same problem. Or someone will come across an interesting article in the popular press or a great new data set to illustrate an idea, or they will share an activity that worked well with their students. The rest of us benefit from reading about what others have done and from knowing we have colleagues scattered across the map who are like-minded and friendly.
Statisticians, by their nature, are helpful people, since helping others is at the heart of statistical consulting. It is no surprise, then, that the statistics and data science education community is overflowing with the most generous, creative, and supportive people you could ever hope to meet. It has been a true blessing to be part of this community for so many years and to have had a chance to nurture the development of one part of the community.
Have you noticed any surprising benefits or outcomes from the community you helped build?
If you are teaching statistics among mathematicians, they might not understand what you are teaching or why you do things the way you do, and they may not care (much as they may not care how physics is taught, or economics, or chemistry). Sometimes this is OK, but sometimes it is not. Elie Wiesel famously said, “The opposite of love is not hate, it’s indifference.” Statisticians teaching in isolation and evaluated by nonstatisticians at tenure and promotion time sometimes experience indifference, often borne of ignorance among those who have never studied statistics. The IsoStat community tries to support its members in those times, partly by lending a sympathetic ear, partly by sharing resources and ideas.
That really isn’t surprising, given what I said before. But one thing we didn’t anticipate in the early days of IsoStat is having the listserv, plus the annual meeting, means we can advertise jobs. I only found out about the statistics position at Oberlin back in 1986 because I happened to see a letter that had been mailed from Oberlin to many PhD-granting departments. Today, one might learn of a teaching-oriented position via the IsoStat listserv.

How can statisticians at small institutions gain visibility and recognition in the broader statistics community? Do you have any practical tips to offer?
The ASA Section on Statistics and Data Science Education is very much open to contributions from statisticians at small institutions. But the main practical tip is to just raise your hand and volunteer.
Career and Impact
You served as a coauthor on both editions of the college-level GAISE report, first published in 2005 and updated to keep pace with changes in statistics and education. How did you become involved with the GAISE writing team?
I have known Joan Garfield and Chris Franklin for many years, and I’m thinking they are probably to blame for my involvement. There was discussion of creating a pair of documents about teaching statistics—one for college and one for K–12—and I had been involved in stat ed activities for many years, so I was invited to work on the college-level team.
By the way, I am kind of proud that I came up with the acronym GAISE. I don’t remember what other names were being considered, but we were going to “gaze into the future” and push for changes we had in mind, so I came up with GAISE. If we hadn’t cared about assessment or the K–12 community, we might have called the report GUISE (Goals for Undergraduate Instruction in Statistics Education), but GAISE is a catchier name.
What do you think are the most important aspects of the GAISE report? Have you seen its influence in your students’ learning and engagement with statistics?
That is hard to say, but I’ll point to “use real data” and “foster active learning.” There was already a lot of movement in both those areas before the first GAISE report came out, so the GAISE committee didn’t promote new thinking so much as it added the imprimatur of the ASA to what more and more people were doing. Just today, a student, out of the blue, commented on how much she enjoyed reading about some interesting real data sets in a course she took last year, and I’ve seen lots of energy in the classroom when we use activities.
The GAISE 2016 report added that students should gain experience with multivariable thinking. Again, this was not novel, but I think having this in the report pushed some of us to think seriously about what we could do in that area. I know I expanded that aspect of my introductory course following the GAISE recommendation.
What are some of the biggest changes you’ve seen in statistics education over your career?
The field of statistics has changed a lot over the decades of my career, with much of this due to changes in technology allowing us to do things that could only be dreamed about earlier. I sometimes wonder how statistics would have evolved if R. A. Fisher and others had had access to the computing power of today. Would there even be such a thing as a t-test if randomization testing had always been possible? How would regression modeling have developed?
But among the biggest changes are the use of activities—often driven by technology—and real data, as mentioned above. Statistics education has moved away from mathematics and toward applications. When I started out, the intro course was called Introduction to Probability and Statistics because we spent a lot of time teaching students about elementary probability, including counting rules for permutations and combinations—a nice part of mathematics but not something many students find terribly useful. Today, we deal with real data and real-world problems. We make and use much better graphics than in the past.
Part of being less mathematical and more practical, today we talk about the conditions that underlie statistical methods, whereas, in the past, we used the word “assumptions”—as if one could just assume a random sample from a normal population.
Moreover, some of us are pushing for the replacement of the horribly misleading words “statistically significant” with the more accurate words “statistically discernible.”
Beyond the introductory level, we use MCMC (Markov Chain Monte Carlo) to implement Bayesian models, and we now teach some of that to undergraduates.
Can you share a memorable moment or achievement from your teaching or mentoring experiences?
There are many from which to choose, but I’ll pick this one: Many years ago, when the Quantitative Literacy project was just getting going, I learned about a QL activity in which we build a confidence interval for a proportion by first generating sampling distributions of sample proportions and then asking, “What population proportions are consistent with the sample we obtained?” (i.e., for what values of p is our p-hat within the middle 90%, say, of the sampling distribution). Using that to construct a confidence interval is conceptually quite different from using the standard CI formula. I remember being excited to share this activity with a group of statistics educator friends, as it was an important part of my journey from mathematics-based traditional thinking to a more open, richer, and deeper understanding of what the practice of statistics can and should be.
Fun
We hear you’re not only a statistician but also a singer, piano player, and writer of parody songs! How did you get started with music? Do you play any other instruments?
I don’t play piano, or anything else (I put away my guitar long before becoming proficient), but I do like to sing. I’ve been singing all my life—not terribly well, mind you, but well enough to be part of a choir.
Do you incorporate your parody songs into your teaching? If so, how do your students respond?
I sometimes sing in class, if there is a song that helps students understand a statistical concept. (See the CAUSE website for ideas.) For example, I often sing Larry Lesser’s song, “What P-Value Means,” and I get the students to sing along, which they seem to enjoy.
What inspires your parody songs, and do you have a favorite?
I like singing, and I like parody, although I don’t write songs very often. I suppose my favorite is “Statistician” (to the tune of “Desperado” by The Eagles), which some of us sang at the US Conference on Teaching Statistics one year.
Advice/Reflection
What advice would you give to new statistics educators starting out today?
Get involved, which is easier than you might think. Try out new activities or data sets, share your experiences, and volunteer to help with projects. I like the saying, “Find your comfort zone and leave it,” even if I have spent much of my career being overly comfortable and not challenging myself as much as I might have. The best things in my career were due to me trying something different, rather than accepting the status quo.
Looking back, is there anything you would do differently in your career?
There are a million things I wish I had done differently. For one thing, I sometimes feel I should send a letter of apology to students who were in my classes in the early part of my career when I wasted time on probability rules, for example, but didn’t teach them the concept of effect size (which is still absent from too many introductory statistics textbooks).
What future projects or goals are you most excited about?
I plan to continue to push for “statistically discernible” to replace “statistically significant” and for the teaching of causal inference with observational data. At one point, I considered writing a textbook that incorporates my thinking, so maybe I’ll do that in retirement. Or maybe I’ll just retire and cheer on younger people who have better understandings of where statistics is and where it should be headed than I do.
Congratulations Jeff on your well deserved Founders award and many contributions to Statistics and Data Science.
YES. Fully appreciate your comments and direction Jeff. It has been a pleasure to have interacted with your work.
Such a great interview that gives a flavor of the commitment to statistics and love of teaching from the best professor (and mentor) that I have ever known!
Congratulations, and thanks for all your insights throughout the years!
Amstat News readers can gain further appreciation for Jeff Witmer’s impactful service and contributions to the field from his keynote at the USCOTS 2025 (https://www.youtube.com/watch?v=SNwCo-aIiaI) and his interview in JSE (https://www.tandfonline.com/doi/full/10.1080/10691898.2019.1603506). Let’s all hope he goes ahead and writes that textbook!