
Patricia Hall and Varghese George, Medical College of Georgia, Augusta University, and Donna LaLonde and Ron Wasserstein, ASA
The 2015–2016 academic salary survey includes both faculty and nonfaculty statisticians and biostatisticians. We received responses from 64 institutions in the United States. The data included 956 faculty and 128 nonfaculty statisticians, with gender information. The quartiles and 90th percentile for relevant categories are provided in the summary tables.
Faculty Data
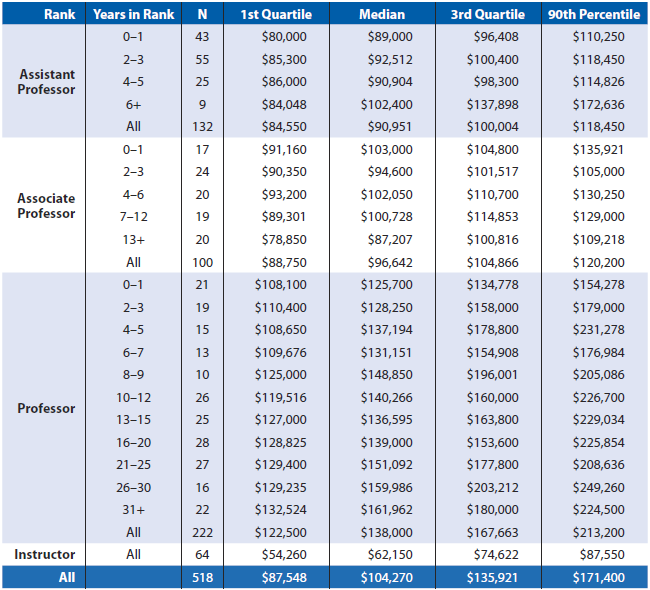
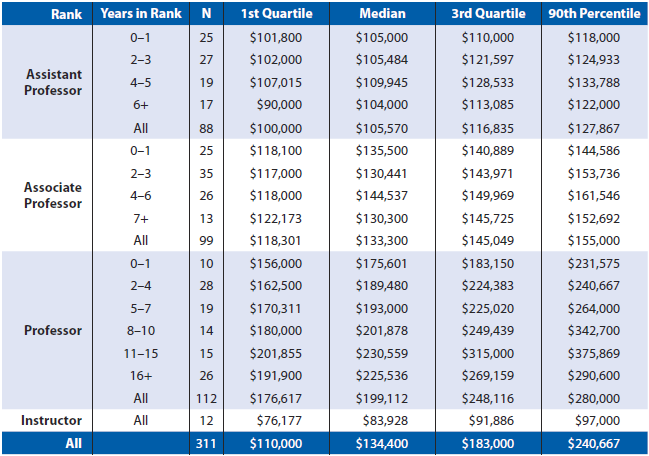
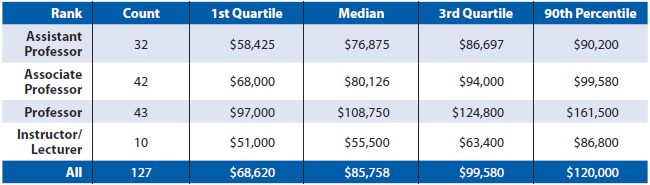
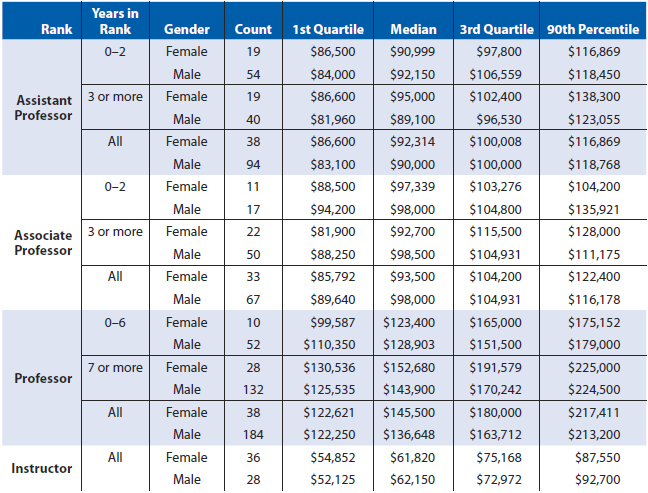
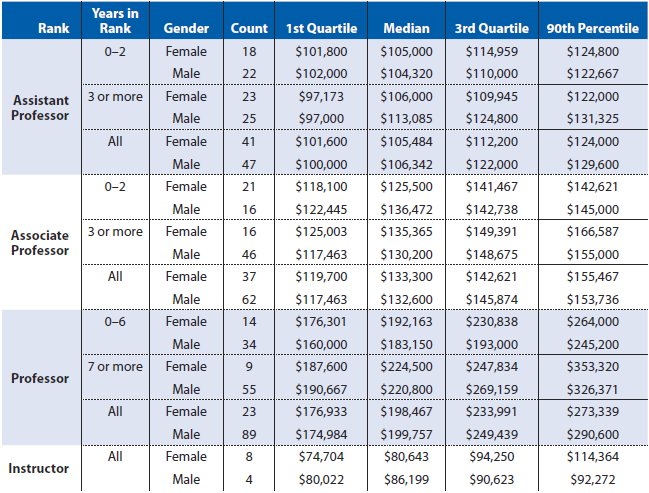
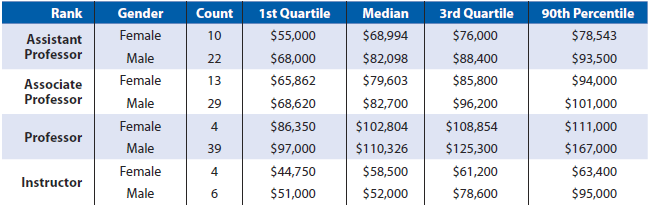
The faculty data set, comprised of 671 males and 285 females, included faculty members in 32 statistics departments (N=518), 16 biostatistics departments (N=311), and 24 math sciences departments (N=127).
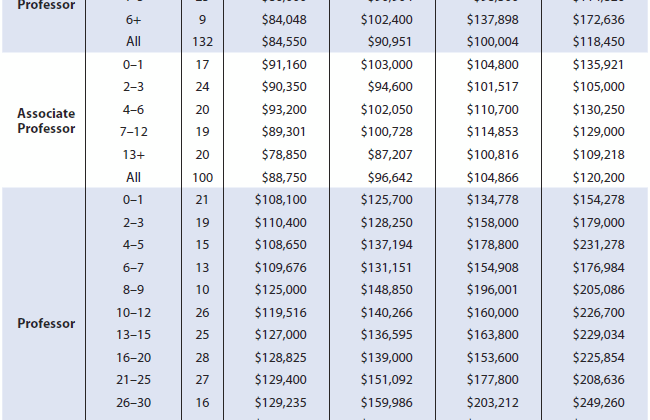
Table 1 summarizes salary information for full-time academic faculty in statistics departments by rank and years in rank, based on a nine-month salary. Table 2 provides similar information for full-time academic faculty in biostatistics departments, but is based on a 12-month salary. Table 3 summarizes salary information on full-time academic faculty in math sciences departments by rank, based on a nine-month salary. A few cases of statistics and math sciences faculty with 12-month salaries were adjusted down by a factor of one-fourth, and a few cases of biostatistics faculty with nine-month salaries were adjusted up by a factor of one-third. Tables 4, 5, and 6 provide similar percentiles for the groups in Tables 1, 2, and 3, respectively, stratified by gender.
Nonfaculty Data
The nonfaculty data set included 128 observations from 21 institutions, with 26 at the doctoral level and 102 at the master’s level. Of the 128 individuals, 101 were from biostatistics departments and 27 from statistics departments. Table 7 provides their salary distribution, stratified by highest degree (master’s or doctorate) and years since obtaining the highest degree.
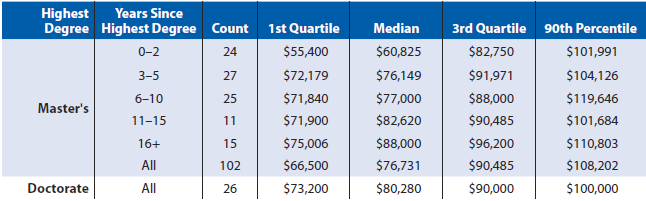
*Includes 27 from statistics departments and 101 from biostatistics departments
Some of these numbers don’t look right, such as Table 5. First, the table legend says that it is by years in rank, and there is no data on that. Second, the numbers are too low–for example, last year’s survey showed that Full Professors in Biostats 12 month salary with only 0-1 year in rank had a first quartile of $165,000, median of $177,800.
Is it possible you are viewing table 6 regarding years in rank? Our original plan was to stratify by years in rank also, but the sample sizes were too small to break it down any further and still make any sense. So we skipped “years in rank”, but forgot to remove it from the caption. I have fixed that.
It looks like your second point refers to Table 2. We don’t have reason to assume that salary estimates must monotonically increase every year. For consistency we kept the same categories, so there are a number of possibilities to explain the decrease. However, your comment does bring up a point about the possibility of collapsing cells to meet a minimum cell size.
Hi Megan,
Thanks for putting this out there. Do you have Table 3 split into categories based on school type? I know in the past you have had a table for statisticians at non-research institutions, such as liberal arts colleges.
Many thanks!
Hi Megan,
I know in the past you have split Table 3 to show information for faculty at non-research institutions (for example, liberal arts colleges). Do you have that information available this time?
Many thanks!
Hi Mike,
We did not collect this information this year but this is another one we have on the list to revisit next year
The American Mathematical Society also completes a faculty salary report. They use our data as a part of their report. The three links below are their reporting on salary.
http://www.ams.org/publications/journals/notices/201604/rnoti-p383.pdf
http://www.ams.org/publications/journals/notices/201604/rnoti-p390.pdf
http://www.ams.org/journals/notices/201604