
This column is written to inform ASA members about what the ASA is doing to promote the inclusion of statistics in policymaking and the funding of statistics research. To suggest science policy topics for the ASA to address, contact ASA Director of Science Policy Steve Pierson at pierson@amstat.org.
Steve Pierson earned his PhD in physics from the University of Minnesota. He spent eight years in the physics department of Worcester Polytechnic Institute before becoming head of government relations at the American Physical Society.

Bachelor’s and master’s degrees earned in statistics and biostatistics continued their strong growth, while doctoral degrees were flat from 2014 to 2015.

Data source: NCES IPEDS

According to the latest preliminary data release from the National Center for Education Statistics, bachelor’s degrees grew 19% to 2,336 (31 of which are for biostatistics) and master’s degrees increased 14% to 3,415 (646 for biostatistics), as seen in Figure 1. Doctoral degrees increased by 2 to 580 (185 for biostatistics). The growth in master’s degrees in statistics is particularly striking, as seen in Figure 2, with a 35% increase over 2014 (9.8% for master’s degrees in statistics).
Accompanying this growth is an increase in the number of universities granting master’s degrees in statistics (from 132 to 136), master’s degrees in biostatistics (51 to 55), and PhDs in biostatistics (31 to 33). After all-time highs in 2014 for number of universities granting doctoral degrees in statistics (67) and bachelor’s degrees in statistics (115), the respective 2015 numbers are 64 and 114.
There were many universities granting statistics and biostatistics degrees for the first time (since 2003) in 2015:
- Bachelor’s degrees in statistics: Albion College, Amherst College, Arizona State University-West, California Baptist University, Siena Heights University, and Williams College
- Master’s degrees in statistics: Kennesaw State University, National University, and New York University
- Master’s degrees in biostatistics: Michigan State University, Indiana University-Purdue University-Indianapolis, Rutgers University, and University of Massachusetts-Amherst
- PhD in statistics: University of Cincinnati
- PhD in biostatistics: Pennsylvania State University-College of Medicine, University of Kansas, and University of Massachusetts-Amherst
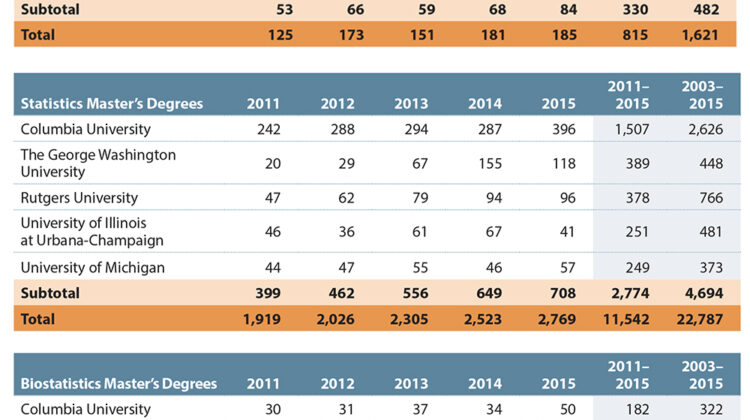
The top degree-granting institutions over the last five years are shown in tables 1–5 for all categories except biostatistics bachelor’s degrees (comprehensive list available).

Demographics

Figure 3 shows the percentage of statistics and biostatistics degrees earned by nonresident aliens. The percentages generally increased for each degree over the last five years, the largest percentages being for PhDs in statistics and the smallest for bachelor’s.

Figure 4 shows race and ethnicity data for the degrees granted to U.S. citizens or residents. For the five degrees (all but biostatistics bachelor’s for which the numbers are small), the percentage of degrees going to those of American Indian or Alaska Native (AIAN) descent is essentially 0%; Asian (ASIA) descent is 20%; black or African American (BKAA) descent is 3–6%; Hispanic or Latino (HISP) descent is 3–6%; Native Hawaiian or Other Pacific Islander (NHPI) descent is 0–1%; White (WHIT) descent is 60%; two or more races (2MOR) is 2%; and race/ethnicity unknown (UNKN) is 4–9%.
For percentage of degrees earned by women, the level held steady at about 44% for bachelor’s degrees in statistics; about 47% for master’s degrees in statistics; and 59% for master’s degrees in biostatistics. For PhDs, the percentage was down a few points to 35% for statistics and 51% for biostatistics.
Leave a Reply