Statistics Education and Reconsidering the Status Quo
The Justice, Equity, Diversity, and Inclusion (JEDI) Outreach Group Corner is a regular component of Amstat News in which statisticians write about and educate our community about JEDI-related matters. If you have an idea or article for the column, email the JEDI Corner manager at jedicorner@datascijedi.org.
Suzanne Thornton is an assistant professor at Swarthmore College, where she teaches undergraduate statistics. Her research interests include the measurement and analysis of social constructs, ethical statistical practice, and the philosophy of science. She hopes her teaching and research work can contribute to the development of accessible educational material in support of statistical literacy for the general public.
Imagine an introductory statistics instructor is teaching students about categorical variables, maybe even discussing how to include these variables in a linear regression model. To keep her students engaged, the instructor asks the students to think about the difference between categorical and numeric variables and solicits examples. The first student to raise their hand confidently exclaims “gender!”
I suspect the majority of you have experienced some version of this story yourselves—either as the student or the instructor. Gender is probably the most common example of a categorical variable in the history of statistical education. Societal structures within and beyond the United States reinforce a binary understanding of gender and encourage us to conflate gender with sex. This is so prevalent that professional scientists can go their entire lives without realizing that both gender and sex are multidimensional constructs. (The former deals with identity, expression, and social and cultural expectations and the latter with clusters of anatomical and physiological traits.)
The American Medical Association, for example, has acknowledged gender as spectrum and that a narrow limit on the definition of sex has public health consequences for transgender and intersex individuals (those born with differences in sexual differentiation).
My colleagues and I recently published an article in Significance magazine addressing this concept from a statistical perspective. In “Towards Statistical Best Practices for Gender and Sex Data,” we provide statistical observations and recommendations concerning various measurement and analysis issues related to human gender and sex. We hope this article provides a simple starting point for statistical practitioners and educators to be better able to distinguish among concepts such as gender identity, gender expression, and sex so we can carefully identify which information is relevant for our analyses, center inclusivity and respect of study participants, and protect the privacy of vulnerable subpopulations.
There are many reasons why this statistical quandary has been on my radar, not the least of which is that my knowledge acquisition of gender diversity occurred simultaneously with my doctoral experience in theoretical statistics. As I journeyed through advanced statistics, I also learned some people prefer not to be limited by your (or my) definition of masculinity and femininity. I discovered hormone treatment therapy is not unique to transgender people, and I realized reproductive ability is an inaccurate measure of sex.
When it was time for me to teach introductory statistics, the conventional gender-binary statistics examples were no longer the simple cases of categorical data analysis I had been taught years ago. Instead, my new knowledge opened an opportunity for a much deeper discussion of measurement and quantitative analysis. What I have subsequently discovered is that the topic of measuring gender and sex in human studies is a rich area that can engage modern statistics students with a deeper understanding of measurement in quantitative analysis. In “Towards Statistical Best Practices for Gender and Sex Data,” I argue that this question is no less intriguing for professional statisticians, as well.
In a classroom setting, an instructor can walk students through the process of defining a categorical variable. For instance, I may ask students how gender is typically categorized. And then follow up by asking, “Who might be excluded or miscategorized based on our variable definition?” And even, “When is it risky to exclude such individuals?”
This is an opportunity to engage with students in discussions about scientific dogma and the role of ethics in data science, not just measurement. The success of such a discussion depends on the instructor’s ability to center respect for the experiences and identities of gender nonconforming (e.g., transgender or nonbinary) or intersex people who, of course, may be present in the classroom.
What we decide to measure and how can affect the scope of our conclusions. In some classes, I have taken the opportunity to include actual examples that allow students to work through this critical thinking process on their own. Consider the following paired questions that relate to evaluating quantitative evidence for or against gender discrimination.
Example
Suppose a large, global supermarket chain is facing a class-action lawsuit for gender discrimination in its job promotion practices. Each store location employs people at two levels: floor worker and supervisor. The claim of the lawsuit is that whether or not an employee is promoted to a supervisory level depends on that employee’s gender identity. To investigate this claim, a random sample of 100,006 supermarket employees is obtained from all store branches in the US.
Question 1
One of the prosecutors suggests collecting gender identity data on this sample of employees and counts those among each position that identify as a woman or not.
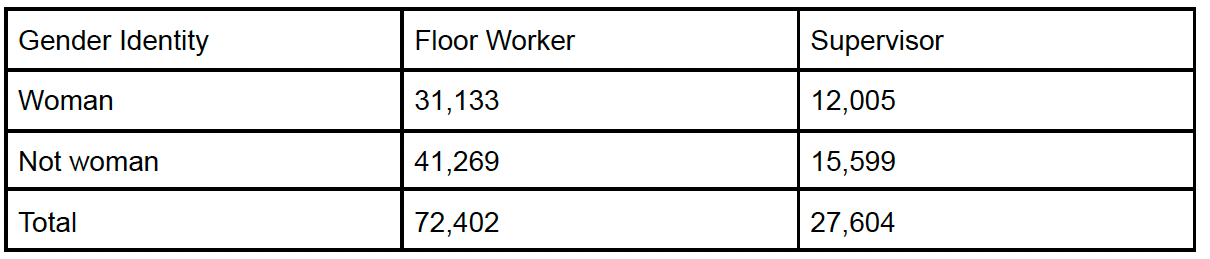
The table above summarizes their findings. Is there evidence of discrimination at an =0.10 level of significance?
Question 2
An intern who works for the prosecutor has recently taken a statistics class and has a different idea. They suggest that, instead of categorizing gender according to a binary system, it is more appropriate to interview these 100,006 employees and ask them if their gender is best described as “cisgender male,” “cisgender female,” or “transgender or gender nonconforming.” (For questions such as this, I provide my students with additional educational material to clarify terms with which they may not be familiar. For instance, see “What do transgender and cisgender mean?”
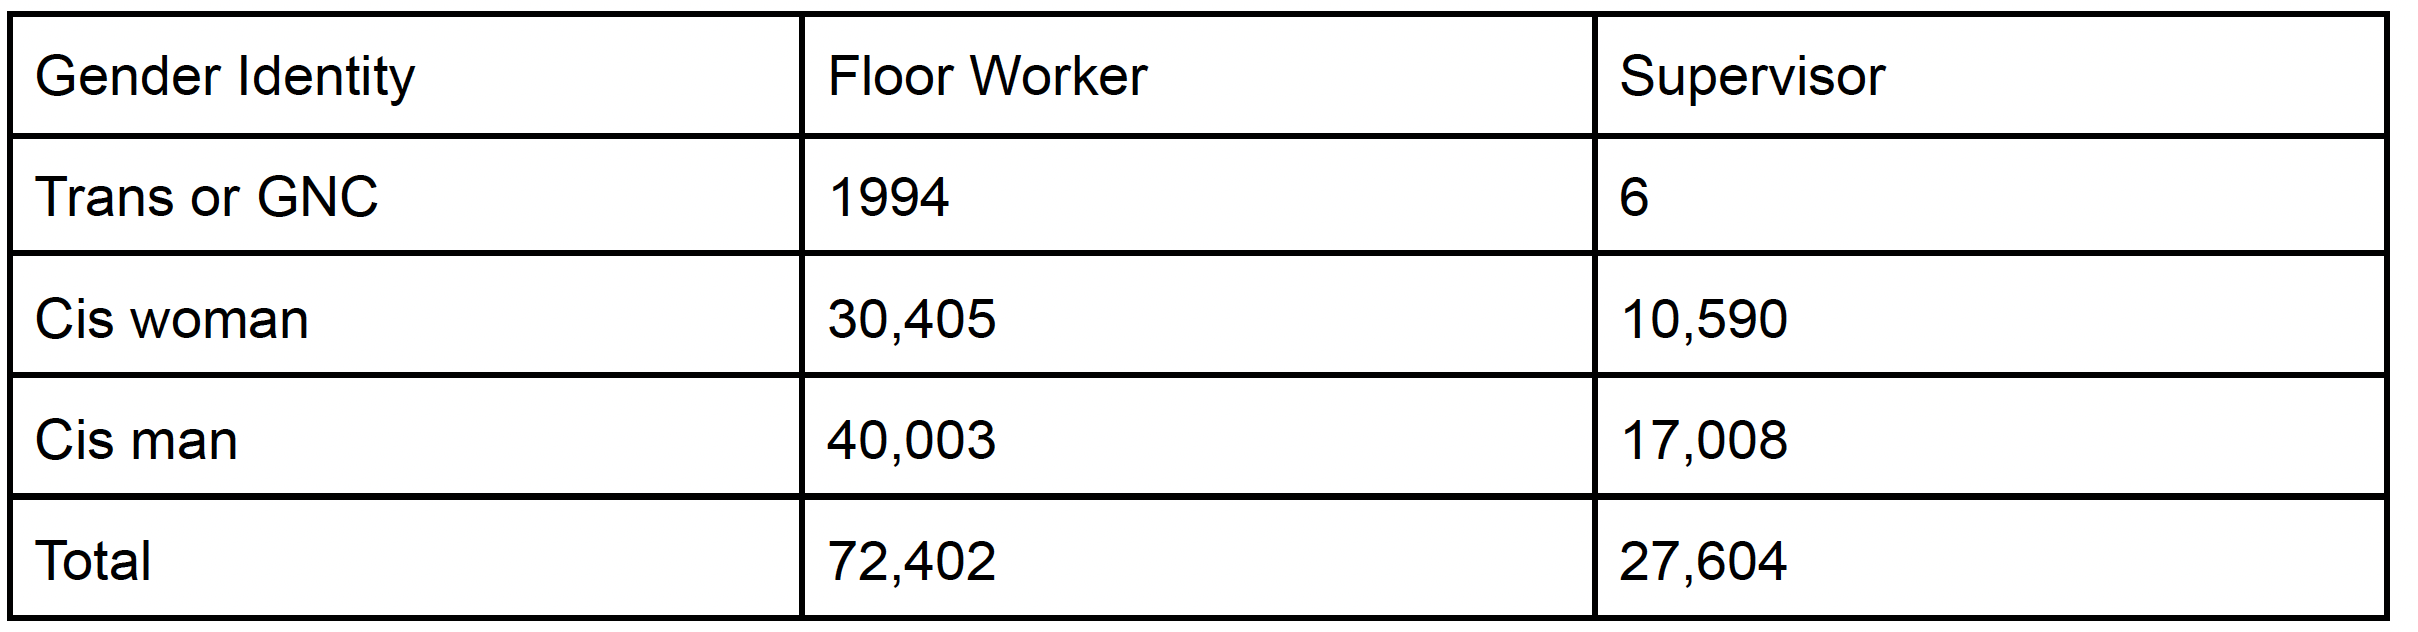
The table above summarizes their findings based on this alternate classification of gender.
Is there evidence of discrimination at an =0.10 level of significance?
For those not wanting to practice these calculations, this example is contrived specifically to illustrate how a failure to reject in Q1 (p-value=0.1642) can become a rejection of the null with redefined levels of the categorical predictor in Q2 (p-value<0.001).
In a statistical sense, this example is not unlike other textbook examples that illustrate tests for a difference in proportions or chi-squared tests for homogeneity. Consider, for example, the Florida death penalty discrimination example in Chapter 2.3.2 of Categorical Data Analysis by Alan Agresti. However, in a broader social context, this example is perhaps more unusual than others because it uses statistical reasoning to challenge societal norms and the status quo. It promotes statistical reasoning in relevant modern contexts. It encourages statistical learners to question other social norms measured in similar ways, such as race and class. Considering the historical proximity of the development of the statistics field and eugenics, perhaps this is a beneficial exercise for every introductory statistics class.
Statistical analysis is crucial for distinguishing between what is science and what is not. But measurement and quantitative analysis are subjective and will always correspond to a particular way of viewing the world. According to Data Feminism by Catherine D’Ignazio and Lauren Klein, “[D]ata are not neutral or objective [and] are the products of unequal social relation[.]”
Historically, when statistics practitioners and educators have ignored this, our society has become instilled with ‘scientific evidence’ for determinants of a ‘superior’ race, justifications for social inequities, and even justifications for slavery. For statistics to move into the well-lit future of fostering inclusion and valuing diversity, we must consider the perspectives from which data is collected and analyzed. This may, in fact, involve reconsidering the status quo.
The tables in this article have been updated as of August 29, 2022.


 (No Ratings Yet)


